

These 2 Charts Tell You Everything About The Biggest Innovation In The Auto Industry
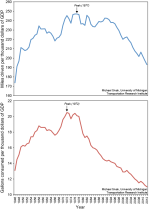
This chart comes from a recent report by Michael Sivak at the University of Michigan's Transport Research Institute.
Sivak is studying whether what he calls "motorization" — people driving cars — has peaked in the U.S.
As you can see, both miles driven per thousand dollars of GDP and gallons consumed per thousand dollars of GDP have plummeted since the 1970s.
What happened? Does this mean that the U.S. will continue to drive less and use less fuel to achieve GDP growth in the future? And what does that mean for the auto industry?
That's the important part. The biggest innovation in cars over the past 40 years hasn't been safety (although cars are much safer than they were in the 1970s) or even the arrival of electric vehicles.
No, the most important innovation in the past four decades has been steadily increasing fuel efficiency.
Levels of economic activity to which American are accustomed can be achieved by driving less and burning less gas. And this trend — down and to the right in the charts — looks set to continue.
And the auto industry isn't worried. After all, this was its idea!
See Also:
