Why The Signal won the election forecasting game
There are two questions to ask when evaluating a political prediction, whether it's from Nate Silver, a pollster, an academic or your favorite Yahoo News predictions blog:
A) How useful was the prediction the day before the election?
B) How useful was the prediction the day after the election?
A great deal of attention is devoted to scoring the performance of various seers and prognosticators on Point A. The Signal went 50 for 51 in that regard, getting every state correct except Florida—of course it was Florida—in our last prediction before voters went to the polls. (We might humbly point out that our original prediction, announced in February, was precisely the same as the one we made on Nov. 5.)
Evaluating Point B is trickier. Have forecasters like Silver, who relies primarily on aggregating polls, taught us anything about how elections work and what motivates voters?
While polls do offer some insight into how public opinion responds to high-profile events—though always at a delay of at least a day—they're powerless to reveal the high-level factors, such as the economy, that influence elections months and even years ahead of time. That's why The Signal prefers to start with models, like the one we debuted in February: It teaches us which factors correlate with election results and which do not.
The 2012 election validated three main insights in our model:
When it comes to economic indicators, it's the trend—whether things are better or worse off than the recent past—rather than levels—the absolute value of unemployment, inflation and so forth—that matters most. The president was re-elected despite historically high unemployment levels, but with trends indicating an improving economy.
State-by-state economic conditions trumped national economic conditions. That is why we predicted back in February that Ohio and Virginia would go to President Barack Obama; both states had above-average growth leading into 2012.
There is a diminishing return to late-breaking economic news. The last few months before the election had massive upward adjustments in job numbers and strong growth, but this new data was not capable of shaking the main narrative of a tepid but consistent recovery. The first and second quarters of the election year have the biggest impact.
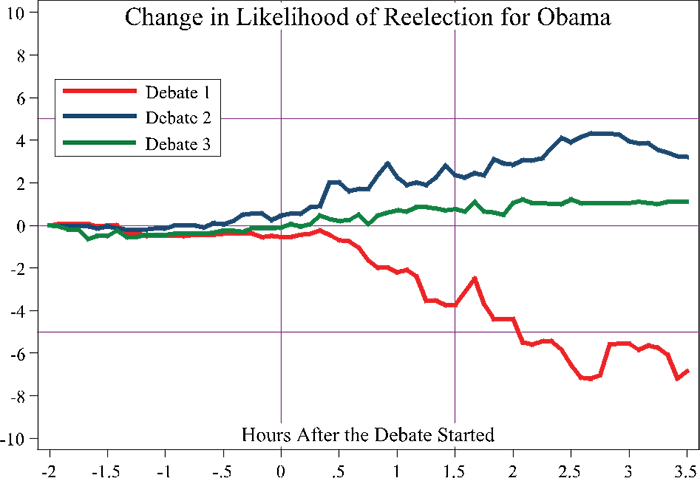
As the election neared, The Signal's model shifted from relying on these large-scale factors to the more workaday polls and prediction markets that many others use. Because the markets respond in real time, we were able to watch how major events moved the needle for Obama and former Gov. Mitt Romney. Here, for example, is an illustration of the shift in odds after each of the three presidential debates:

Sources: Betfair, Intrade, IEM, HuffPost's Pollster, RealClearPolitics
The drop in likelihood of victory that Obama incurred after his first debate was the largest I have seen in the past few cycles. The diminishing value of each successive debates is consistent with the past election cycles. It's a useful lesson to remember—first impressions matter.
Forecasting elections is about more than getting it correct (though that's a good place to start). It's also understanding why you were right.
David Rothschild has a Ph.D. in applied economics from the Wharton School of Business at the University of Pennsylvania. Follow him on Twitter @DavMicRot.

