Global warming blowout: Record highs beat record lows by 48-to-1 ratio in November
UPDATE: Dec. 3, 2016, 3:22 p.m. EST Updated data from NOAA indicates the ratio of daily record highs to record lows was 48-to-1 in November, once additional numbers from Nov. 30 were included. This story has been edited to reflect this update.
As the planet warms in response to the buildup of greenhouse gases in the atmosphere, the ratio of high temperature records compared to low temperature records has become more skewed. If the climate weren't warming, that long-term ratio should average out to about 1-to-1.
However, that isn't the world we're living in. A 2009 study found that the record highs to lows ratio was 2-to-1 for the lower 48 states during the 2000s, and this disparity has only grown since then. Projections show the imbalance increasing in coming decades as global warming continues.
Keeping in mind that individual months show considerable variability in weather patterns, it's clear that over the long-term, the ratio of record highs to record lows is now strongly favoring record highs as well as record warm overnight temperatures. This is consistent with computer model projections of a warming world.
SEE ALSO: Arctic air poised to invade the U.S. after record warm November
No individual month shows this better — and to a ridiculous degree — than November 2016.
New, preliminary numbers from the National Centers for Environmental Information (NCEI) show that during November, the ratio of record highs (4506) to record lows (94) was a shocking 48-to-1.
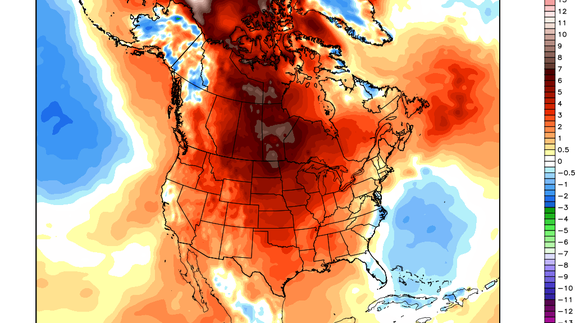
Here's how November shaped out. Who wants to write a journal article on the role played by the Siberian High in producing mega warmth? pic.twitter.com/baARGI7rUt
— Michael Ventrice (@MJVentrice) December 1, 2016
According to Guy Walton, a former Weather Channel meteorologist who meticulously tracks these records, this year is on track to have the lowest tally of record low temperatures since 1922 and the highest ratio of daily record highs to lows — at about 6.6-to-1.
Comparing the number of temperature records has some limitations, but the ratios are more accurate in reflecting how the U.S. has warmed in recent decades, according to Deke Arndt, chief of climate monitoring at the NCEI in Asheville, North Carolina.
"Because the number and lifetimes of weather stations has varied over time, comparing raw numbers of records doesn't completely capture the signal," he said. "Using a ratio of warm-to-cold records helps account for these effects."
All of North America, including Canada, had an unusually warm November, with many cities in the Midwest, Alberta and other Canadian provinces setting records for the warmest November on record.
A Nov. 21 study published in the journal Proceedings of the National Academy of Sciences found that by midcentury, the ratio of record daily high temperatures to record daily lows will likely be about 15-to-1, depending on the pace of greenhouse gas emissions.
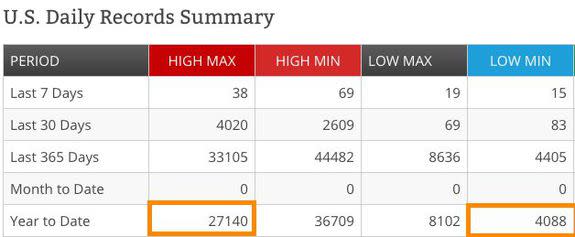
Image: noaa/ncei
December promises to be far colder in these areas as the weather pattern changes from the Pacific Ocean across North America, though it is unclear whether record highs will still outnumber record lows.
Globally, 2016 is on pace to set a record for the warmest year since at least 1880, beating the milestone set last year.
The warm year has seen a host of extreme events linked to global warming, including catastrophic flooding in Louisiana and North Carolina, a worldwide coral bleaching event that devastated parts of Australia's Great Barrier Reef as well as other impacts.
