
US Dollar at Interim Support, S&P 500 Attempts to Probe Lower
THE TAKEAWAY: The US Dollar has found interim support after last week’s selling while the S&P 500 is attempting to cautiously probe downward.
US DOLLAR TECHNICAL ANALYSIS– Prices turned lower as expected taking out the bottom of a rising channel set from late January. Prices have found initial support at 10454, the 14.6% Fibonacci retracement, with a bounce from here aiming to retest the channel bottom (now at 10540). A push back above that targets the March 11 high at 10576. Alternatively, a reversal below support targets the 23.6% Fib at 10379.
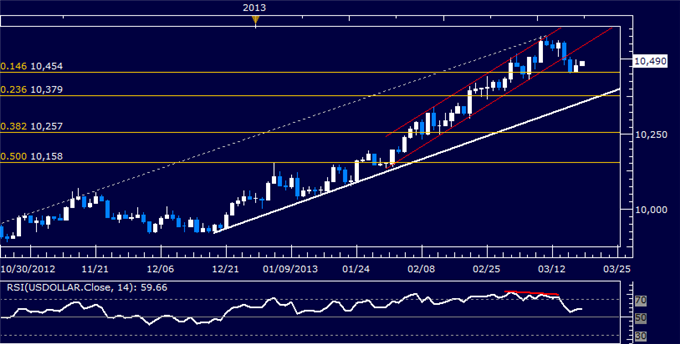
Daily Chart - Created Using FXCM Marketscope 2.0
S&P 500 TECHNICAL ANALYSIS – Prices probed lower after putting in a bearish Harami candlestick pattern. Initial support is at 1531.50, the 14.6% Fibonacci retracement, with a break below that exposing the 23.6% level at 1511.60. Near-term resistance is at 1563.90, the March 15 high. A reversal above that targets the index’s record high at 1576.10. Negative RSI diverge argues in favor of a downside scenario.
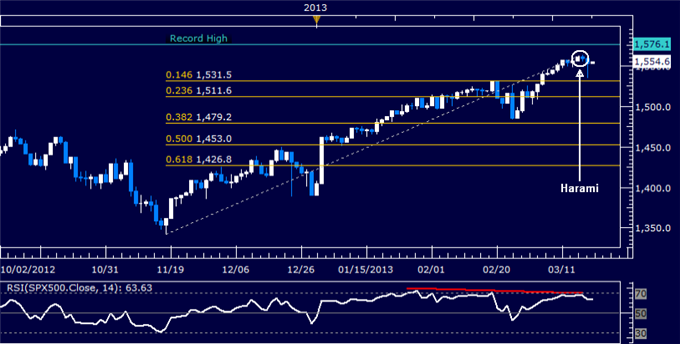
Daily Chart - Created Using FXCM Marketscope 2.0
GOLD TECHNICAL ANALYSIS – Prices narrowly edged above resistance at 1604.87, the 38.2% Fibonacci retracement, exposing the 50% level at 1620.28. A further push above that aims for the 61.8% Fib at 1635.68. The 1604.87 mark has been recast support, with a turn back beneath that eyeing the 23.6% retracement at 1585.81.
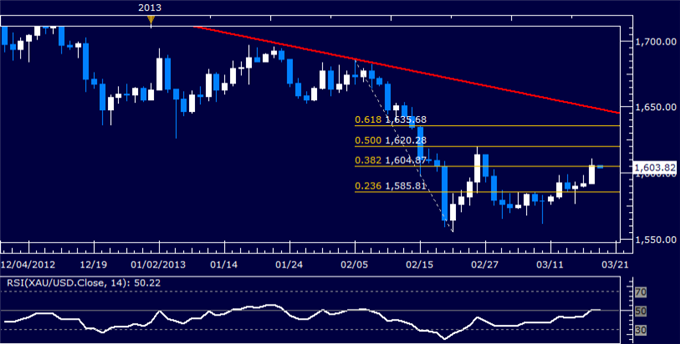
Daily Chart - Created Using FXCM Marketscope 2.0
CRUDE OIL TECHNICAL ANALYSIS– Prices narrowly took out resistance at 93.69, the 50% Fibonacci retracement, exposing the 61.8% barrier at 94.73 as the next upside objective. The 93.69 mark has been recast as near-term support. A reversal back beneath that aims for the 38.2% Fib at 92.66.
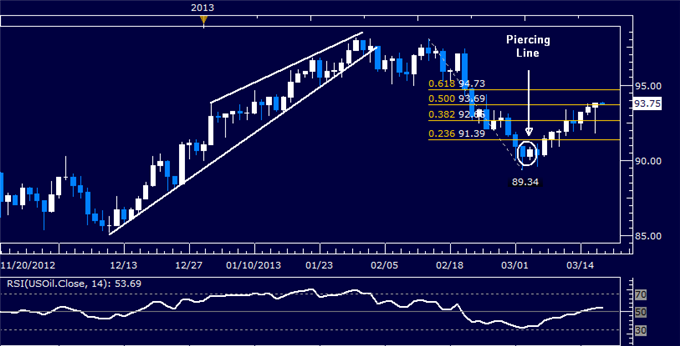
Daily Chart - Created Using FXCM Marketscope 2.0
--- Written by Ilya Spivak, Currency Strategist for Dailyfx.com
To contact Ilya, e-mail ispivak@dailyfx.com. Follow Ilya on Twitter at @IlyaSpivak
To be added to Ilya's e-mail distribution list, please CLICK HERE
New to FX? Watch this Video. For live market updates, visit the Real Time News Feed
DailyFX provides forex news and technical analysis on the trends that influence the global currency markets.
Learn forex trading with a free practice account and trading charts from FXCM.

