
US midterm elections: An online guide to find where to vote and track results

It's Election Day in the US, with dozens of Congressional seats in contention, gubernatorial races, and local elections taking place all around the country. Here's a breakdown of online guides, tools, and services that will help you find who's on the ballot, where to vote, and how to track the results.
How do I vote?
In many states, you can now register to vote online, ask Google "how to vote," and then go to the polls to fulfill the fundamental right of a citizen. This year, the search engine giant has made this easier than ever: just type in "where is my polling place," click search, and you'll find an info box with a field for a more specific search, map, and relevant links. Google Now users have been getting election information cards since the beginning of October. The data behind these new search-mediated services comes from a nonprofit focused on long distance voter registration.
Where do I vote?
WhereToVote.org, built by Marjorie Roswell and Joseph Challmes, features a number of ways to connect voters to their local polling place, including the Voting Information Project.
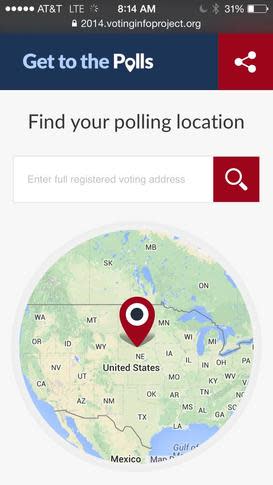
This easy-to-use voter information tool created by a partnership between The Pew Charitable Trusts, Google, and states can be embedded on any webpage. The project also provides a way for voters to get text-based election information through txt messaging: just text "VOTE" or "VOTO" to 69520.
The project uses Google's Civic Information API, which enables anyone to build a mobile or web application that provides a better interface for the raw materials of democracy.
What do I need to vote?
As Nancy Scola reported at The Washington Post, Google has incorporated location-aware voter identification requirements into search results that will, in theory, make it easier for people to vote in the US, coupled with efforts like Rock the Vote, which focus on civic literacy and public engagement. In practice, however, there's a wide gradient in how voter-friendly states are, with varying requirements for identification, hidden costs, availability of early voting, training of polling workers, and quality of voting equipment.
The Department of Justice will be doing on-the-ground monitoring of the polls in 18 states this Election Day. If you see problems that are potential violations of the federal voting rights law, you can call the civil rights division at 1-800-253-3931 or 202-307-2767 or TTY (202-305-0082), fax complaints to 202-307-3961, email voting.section@usdoj.gov, or file a complaint online. You can help monitor problems at the polls around New York City by participating in the PollWatchUSA project.
If you haven't registered to vote before Election Day, you're out of luck in 80% of the US, but 10 states plus the District of Columbia do offer same-day registration: make sure to bring proof of residency and a valid ID to the polls. If you're outside of the US or serving in the military, LongDistanceVoter.org and the U.S. Vote Foundation offers online information regarding a federal write-in absentee ballot.
Whom do I vote for?
As always, that's up to you! There are more voting guides online than ever before. Some are better than others, in terms of how well they break down the issues and candidates' positions, like this WNYC guide. The League of Women Voters has a great index of voting guides and personalized information that should get you started, if you're still undecided on Election Day. VoteSmart.org has an index of 42 state elections and 158 ballot measures around the US.
What do I do after I vote?
Tell other people that you voted! No, seriously: remember to tweet #IVoted, update Facebook, post on Instagram or Pinterest, and wear a sticker. We know social networks affect voter turnout, although the ways they do so aren't always clear to users. When other people see your public update about voting, many will be influenced to go engage in this fundamental democratic act as well.

There are already a few experiments online that can tell you about whether your friends voted, like this one in Oregon, and you can bet some data-driven campaigns will be trying to use data and social networks to nudge voters today.
Please do not, however, take a selfie of yourself while voting, or record a video of your marked ballot, the action of voting, or other people without first consulting your state's law on documenting votes: it may be illegal to Instagram your ballot.
If you're feeling creatively challenged, share links and images from online art projects like GoVote. The GoVote site includes an election information hub with a voting FAQ.
How can I follow election results and candidates?
Every broadcast network and radio station will be covering what's happening on Election Day, and then switching to live coverage as the results come in as the polls close. For decades, media companies have been competing to offer the best broadcast coverage on election night, first on radio, then broadcast television, then on cable.
The emergence of the internet as a fundamentally disruptive force in media changed how election results could be collected, published, and displayed on TVs, tablets, smartphones, and laptops. In the 2012 election, data-driven election analysis and campaigning were the big winners. This year, more campaigns have adopted data analysis and targeting technology, and more media organizations have taken forecasting and predictive modeling to new heights.
"The HuffPost's Pollster site and API has been a fantastic resource for exploring the types and characteristics of political polls in my class," said Dan Nguyen, a lecturer in Stanford's journalism school, in an email. "The charts are very well done themselves, but I greatly appreciate how they've made the details of each poll easily accessible."
Pew Trusts, which funds the Voting Information Project, also provides ElectionDesk to state and local election officials. The open source platform enables state and local election officials to monitor issues on social media, filtering by geographic area and topic, and interact with voters in real time on election day on Twitter, Facebook, Google+, and other services. Unfortunately, it's not available to the public.
Regardless of how the news is predicted or published, the election data many of those news organizations (Reuters has its own data service) depend on comes from a national network of 5,000 Associated Press workers collecting exit polls and analyzing returns as they come in. Over the past 20 years, practitioners of data-driven journalism have created faster, better designed, and more adaptive news applications based upon that data. Every election cycle, unfortunately, many newsroom teams end up essentially duplicating the work of others media organizations and then competing for eyeballs and audiences. The good news for audiences is that when the national results are effectively commoditized, it enables smart, careful analysis of returns and mobile-friendly presentations.
Online, The New York Times live blog of election returns, authored by reports and editors and featuring a simple electoral dashboard will be a great one to keep open in a tab. Another source worth noting is NPR's election app, which combines an online livestream of the broadcast with a simple, mobile-friendly "big board" of results and, for the first time, makes it available through Google Chromecast devices.

"We envision this all coming together in a way that feels a lot more like a TV station than a website," wrote Brian Boyer, leader of NPR's visuals team, in an email. "Cards of information will rotate on-screen, with little user input. The cards in the rotation will change throughout election night, as certain scorecards become interesting, as we ask new questions of our audience, as photographs arrive from parties nation-wide, etc."
While national media compete to deliver the best-designed, fastest, most mobile-friendly presentations of returns with national import, regional news organizations generally provide the best coverage of local elections, aided by genuine technical innovation in the use of the web to inform the public.
For instance, The Oregonian now delivers near-real-time election results for the state of Oregon online.
"The Oregon Elections Division publishes statewide results more slowly than do our 36 counties, so we assemble a data entry team on Tuesday night to hit every county's site," explained Steve Suo, leader of the data and interactives team, via email.
"Scraping would seem an option, but a good number of rural counties put up image files of printed pages, believe it or not; the brute force of manual labor works best in this situation. This approach reliably makes our news organization the first to call every statewide race. Our database flows in near real time -- updates once a minute -- onto the site to feed bar charts on each race. As soon as our results team makes a call, a checkmark automatically appears next to the winner's bar, and a tweet goes out to our followers. We also make the county-by-county available in clickable map form. We've done this since the 2008 presidential as early adopters of JSON feeds. What's evolved since is that we no longer use Flash for the graphics and now use responsive, mobile-friendly design."
If you like to follow sources directly, Twitter has compiled a list of 1,614 candidates and incumbents for the gubernational and Congressional elections. It's a good bet that many election results will break there first, which, along with the social network's #Election2014 dashboard, continue to make it a destination for political junkies. Facebook launched a midterm dashboard last month. I'll be following along on Twitter's #Election2014 dashboard and watching the returns come in from Washington.
