After 2 years, we finally know how many Treasure Coast residents died from COVID
You didn’t forget about the coronavirus, did you?
The federal COVID-19 Public Health Emergency ended in May, but on the Treasure Coast monthly infections rose throughout the summer — peaking at nearly 2,600 in August.
That eighth wave of infections in the tri-county area has ended, with new cases steadily decreasing in September, October and November. Remaining diligent over the winter holidays, however, will keep things trending in the right direction, according to a local physician.
Stave off virus transmission indoors by ensuring proper ventilation is available, and gather outdoors if possible, advised Dr. Ramesh Gopalaswamy, of HCA Florida Lawnwood Hospital in Fort Pierce.
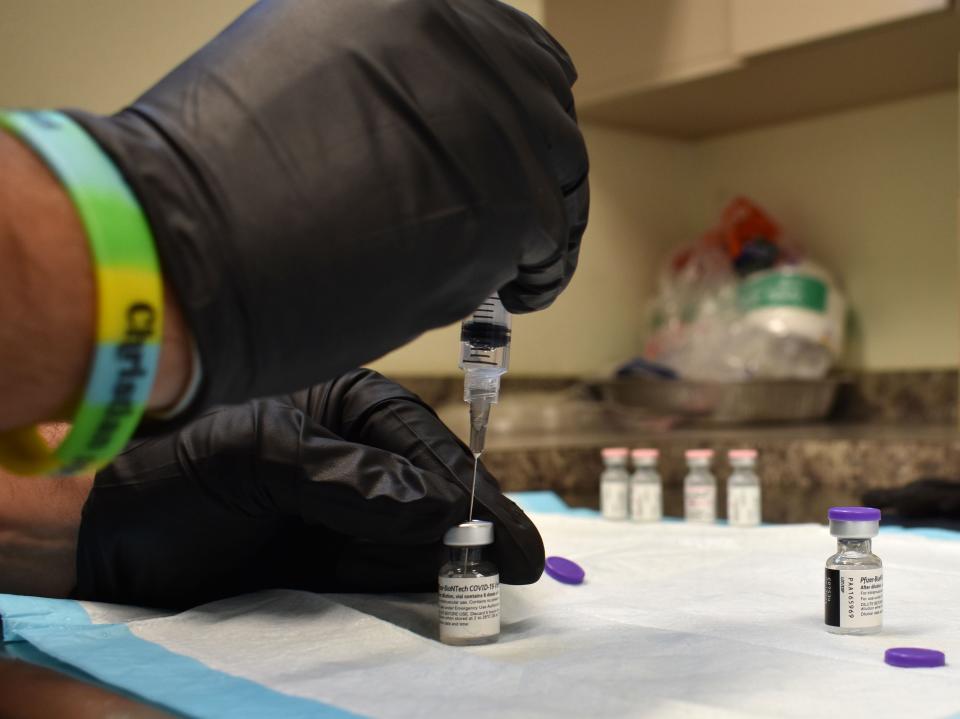
Also consider masking up in crowded, high-risk situations, he said, and be sure to get a booster dose of the COVID-19 vaccine, which was updated again this fall.
“Protect the most vulnerable in the group — old or immunocompromised — by surrounding them with people who are adequately vaccinated,” Gopalaswamy said, thus forming a “so-called ‘immune cocoon.’ ”
Much has changed in the post-pandemic era, namely how the Florida Department of Health reports COVID-19 data:
Beginning March 2020, the agency published robust state- and county-level reports to a public archive, sometimes twice a day.
In June 2021, the daily reports became weekly. They also were pared down — no longer featuring such information as deaths per county or any hospitalization data — and saved in another folder.
In March 2022, those publications became biweekly, with the final document posted Oct. 13, 2023.
The streamlined data now resides at FLHealthCharts.gov, and once again includes key metrics such as age, sex, race and ethnicity for each county.
COVID cases
September cases (difference from August)
Martin: 375 (36% decrease)
Indian River: 527 (15% decrease)
St. Lucie: 850 (39% decrease)
Treasure Coast: 1,752 (33% decrease)
Florida: 57,197 (38% decrease)
October cases (difference from September)
Indian River: 205 (61% decrease)
Martin: 293 (22% decrease)
St. Lucie: 437 (49% decrease)
Treasure Coast: 935 (47% decrease)
Florida: 27,118 (53% decrease)
November cases (difference from October)
Indian River: 154 (25% decrease)
Martin: 176 (40% decrease)
St. Lucie: 303 (31% decrease)
Treasure Coast: 633 (32% decrease)
Florida: 21,975 (19% decrease)
COVID deaths
September deaths (difference from August)
Martin: 5 (69% decrease)
St. Lucie: 7 (76% decrease)
Indian River: 14 (56% increase)
Treasure Coast: 26 (52% decrease)
Florida: 922 (5% increase)
October deaths (difference from September)
Indian River: 7 (50% decrease)
St. Lucie: 8 (14% increase)
Martin: 10 (100% increase)
Treasure Coast: 25 (4% decrease)
Florida: 596 (35% decrease)
November deaths (difference from October)
Indian River: 3 (57% decrease)
Martin: 5 (50% decrease)
St. Lucie: 8 (no change)
Treasure Coast: 16 (36% decrease)
Florida: 373 (37% decrease)
Prior to the autumn release of this data, Floridians had been in the dark about local death statistics for over two years. Health department county offices occasionally would provide such information, but TCPalm largely relied on data from the U.S. Department of Health and Human Services.
When the federal COVID-19 Community Profile Report ceased publication in February 2023, TCPalm began referring to provisional HHS death counts. However, the latter far underestimated deaths in St. Lucie and Indian River and overestimated them in Martin, compared to what the agency previously had reported, and stopped being updated in June.
In August, TCPalm reported that cumulative Treasure Coast deaths likely exceeded 2,936; state statistics now reveal nearly 3,200. The deadliest month of the pandemic was August 2021, with over 330 deaths reported.
COVID hospitalizations
September hospitalizations (difference from week of Aug. 27-Sept. 2)
Sebastian River Medical Center: 14 (26% decrease)
HCA Florida Lawnwood Hospital: 23 (36% decrease)
HCA Florida St. Lucie Hospital: 46 (48% decrease)
Cleveland Clinic Indian River Hospital: 63 (21% decrease)
Cleveland Clinic Martin Health (Tradition, Martin North and Martin South hospitals): 91 (43% decrease)
Overall: 237 (38% decrease)
October hospitalizations (difference from week of Sept. 24-30)
Sebastian River: 20 (43% increase)
Lawnwood: 23 (no change)
Indian River: 29 (54% decrease)
St. Lucie: 46 (no change)
Martin Health: 56 (38% decrease)
Overall: 174 (27% decrease)
November hospitalizations (difference from week of Oct. 22-28)
Sebastian River: 7 (65% decrease)
St. Lucie: 20 (57% decrease)
Lawnwood: 31 (35% increase)
Martin Health: 36 (36% decrease)
Indian River: 41 (41% increase)
Overall: 135 (22% decrease)
September patients included COVID-positive adults hospitalized the week of Sept. 24-30, as reported by HHS. October patients refer to those hospitalized the week of Oct. 22-28, and November patients refer to those hospitalized the week of Nov. 19-25.
COVID vaccinations
September vaccinations (difference from August)
Indian River: 3,055 (700% increase)
Martin: 3,215 (927% increase)
St. Lucie: 4,763 (641% increase)
Treasure Coast: 11,033 (725% increase)
Florida: 329,447 (474% increase)
October vaccinations (difference from September)
Martin: 5,435 (69% increase)
Indian River: 6,578 (115% increase)
St. Lucie: 9,379 (97% increase)
Treasure Coast: 21,392 (94% increase)
Florida: 606,746 (84% increase)
November vaccinations (difference from October, through Nov. 25)
Martin: 2,236 (59% decrease)
Indian River: 2,570 (61% decrease)
St. Lucie: 3,418 (64% decrease)
Treasure Coast: 8,224 (62% decrease)
Florida: 239,849 (60% decrease)
Monthly vaccinations reflect doses administered, not individuals immunized, explained health department spokesperson Jae Williams. A person who has received multiple doses may appear only once in a given month. See below for cumulative persons vaccinated.
COVID cases since March 2020
Martin: 43,135
Indian River: 45,217
St. Lucie: 100,923
Treasure Coast: 189,275
Florida: 7,863,198
COVID deaths since March 2020
Indian River: 834
Martin: 850
St. Lucie: 1,515
Treasure Coast: 3,199
Florida: 92,459
Cases and deaths are current as of Dec. 11.
COVID vaccinations since December 2020
Martin: 113,248
Indian River: 122,085
St. Lucie: 228,000
Treasure Coast: 463,333
Florida: 16,593,930
Vaccinations are current through Nov. 25 and refer to Florida residents who have received at least one COVID-19 vaccine dose.
National omicron variant proportions (2 weeks ending Dec. 9)
30%: HV.1
21%: JN.1
9%: EG.5
8%: HK.3
7%: JD.1.1
Omicron, known for its high transmissibility, remains the Centers for Disease Control and Prevention’s only SARS-CoV-2 “variant of concern.” The above lineages and sublineages accounted for most infections nationwide from Nov. 26 through Dec. 9.
Lindsey Leake is TCPalm’s projects reporter. She has an M.A. in Science Writing from Johns Hopkins University, an M.A. in Journalism and Digital Storytelling from American University and a B.A. from Princeton University. Follow her on X @NewsyLindsey, Facebook @LindseyMLeake and Instagram @newsylindsey. Call her at 772-408-5315 or email her at lindsey.leake@tcpalm.com.
Read more of Lindsey’s stories and support her work with a TCPalm subscription.
This article originally appeared on Treasure Coast Newspapers: Florida COVID: Fall 2023 cases drop in Martin, St. Lucie, Indian River

