3 Big Stock Charts for Monday: Merck, Facebook and Microsoft
The market didn’t end last week on a high note, but then again, it didn’t need to. Even with Friday’s 0.07% setback for the S&P 500, the index still mustered just a little less than a 1% advance for the five-day stretch. That makes a third winning week in a row.

Source: Shutterstock
Oversized Apple (NASDAQ:AAPL) is the reason the broad market could get up and over the hump, falling nearly 2% in Friday’s action after investors rethought the costs related to the company’s strategy of attracting people to its hardware and new streaming service. That impact was more than smaller names like General Electric (NYSE:GE) could offset. GE was up nearly 1% on the last day of last week, buoyed by optimism surrounding what should amount to a $5 billion debt reduction, funded by asset sales.
As for names worth exploring as Monday’s action gets going, however, the stock charts of Facebook (NASDAQ:FB), Microsoft (NASDAQ:MSFT) and Merck (NYSE:MRK) are of the most interest. Here’s why.
InvestorPlace - Stock Market News, Stock Advice & Trading Tips
Microsoft (MSFT)

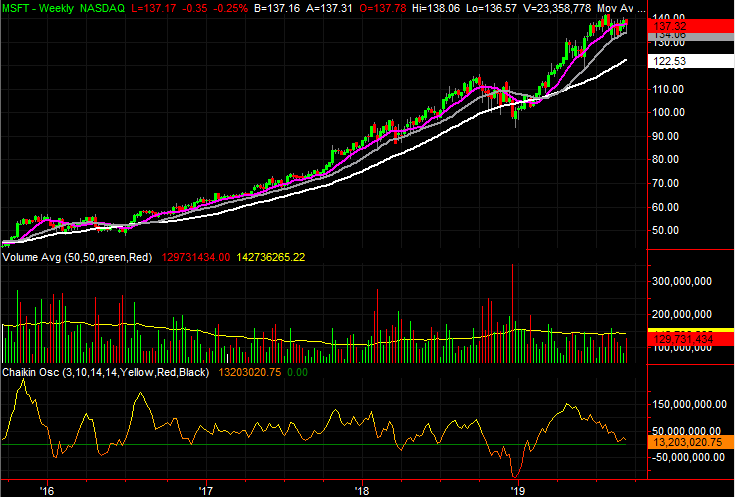
There’s no denying Microsoft shares have been one of the market’s best and most reliable performers for years now. Even the headwind that hammered most names late last year wasn’t horrific for MSFT stock, and shares recovered quite nicely this year from that lull.
This year’s overheated rally looks like it has run its full course though, progressing even faster than the 2017/2018 gain. Although it’s not past the point of no return yet, the action since late July suggests the bears are taking their shot. They’ve been nice enough to leave clear clues.
The biggest clue to speak of is the converging wedge shape that’s formed since July. The lower boundary, plotted in blue, traces all the lows going back to December’s low.
Although not overwhelmingly so, the volume tide has started to lean bearishly. Should the Chaikin line on the weekly chart fall under zero, that may be the proverbial tipping point.
As for a plausible downside target, the past two major setbacks have pulled Microsoft shares just below the 200-day moving average line, marked in white on both stock charts.
Merck (MRK)

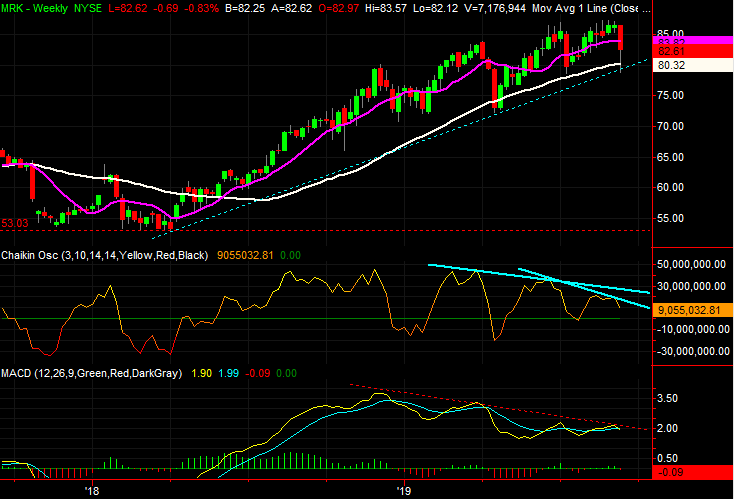
Shares of drugmaker Merck have dished out a healthy, even if at times uneven, rally over the course of the past year and a half. Even factoring in the current lull, MRK stock is still up 56% from its early 2018 low.
The complexion of that advance has slowly but surely — maybe even imperceptibly — taken a turn for the worst though. While still seemingly in bullish mode, the momentum is fading and the pokes at key technical floors are more frequent and more potent.
The slowdown of the advance is easily indicated on the daily chart, with each resistance line, marked in yellow, plotted at a shallower direction than the prior one.
It’s not a detail even the most focused of chart watchers would notice or care about, but each peak of the Chaikin line since the beginning of this year has been lower than the past, underscoring the slowdown. Ditto for the MACD crossunders.
So far the 200-day moving average line, marked in white on both stock charts, has held up as a floor. The straight-line support that tags all the key lows since early 2018, however, was tested again last week. That’s the make-or-break level, marked as a dashed blue line on the weekly chart.
Facebook (FB)

It’s interesting. All stock charts demonstrate some degree of interplay with their moving average. Sometimes it means a lot, and sometimes it means little. It’s something that at the very least has to be respected though.
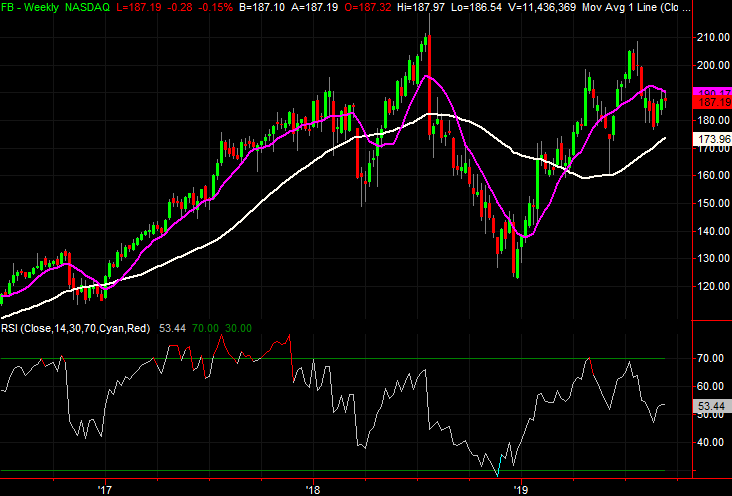
To that end, Facebook has been strangely responsive to its moving average line, sometimes being stopped and reversed at them, and other times being blasted past them when they’re passed. That’s what makes the past couple of weeks so curious … and a little bearish.
The chief worry here is how FB stock tested but failed to hurdle the 50-day moving average line, plotted in purple on both stock charts, this month. As the daily chart shows, the 50-day line has been a biggie.
That being said, there are still a couple of other, albeit less meaningful, moving average lines that have been boundaries in the past that could become a boundary again.
Fueling the prospect of more downside is the fact that, over the long haul, FB stock is no stranger to major moves. The stock is still closer to being overbought than not from this year’s rebound move, as indicated by the weekly chart’s RSI tool.
As of this writing, James Brumley did not hold a position in any of the aforementioned securities. You can learn more about him at his website jamesbrumley.com, or follow him on Twitter, at @jbrumley.
More From InvestorPlace
The post 3 Big Stock Charts for Monday: Merck, Facebook and Microsoft appeared first on InvestorPlace.

