3 Big Stock Charts for Tuesday: Twitter, Lowe’s and Procter & Gamble
Following through on Friday’s bullishness, more hope on the trade front spurred the S&P 500 up to the tune of 1.21%. The move left behind a gap, though, and still left the index under a couple of key moving average lines that could be resistance.

Source: Shutterstock
Chinese stocks led the charge. Enthused about the prospect of rekindled trade between China and the United States, Baidu (NASDAQ:BIDU) rallied nearly 8% during the regular session headed into its post-close earnings report. But, shares jumped nearly another 9% on numbers investors liked.
Iqiyi (NASDAQ:IQ) was up almost 6% during yesterday’s regular-hours session, but didn’t see the same post-close fate as Baidu. IQ stock fell more than 9% after Monday’s closing bell rang. Revenue came up short of expectations and guidance was less than thrilling as well.
InvestorPlace - Stock Market News, Stock Advice & Trading Tips
Holding the market back was General Electric (NYSE:GE), down 1.4% as investors continue to grapple with recent accusations that its balance sheet under-reflected its true risks.
As for names worth a closer, trading-oriented look headed into Tuesday’s session, check out the stock charts of Lowe’s (NYSE:LOW), Procter & Gamble (NYSE:PG) and Twitter (NYSE:TWTR). Here’s what’s most noteworthy.
Twitter (TWTR)

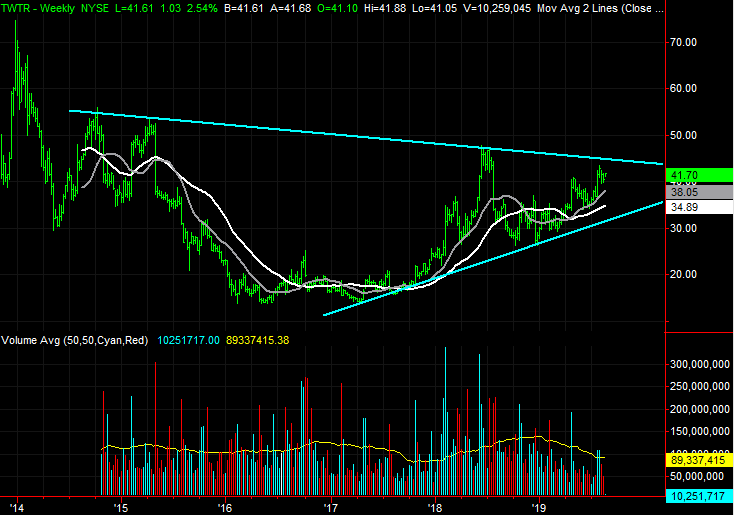
It has been incredibly erratic action, but progressive action nonetheless. That is, Twitter shares are being guided upward, squeezed toward the narrowing tip of an ascending wedge pattern. More recently, TWTR stock has been finding support at levels that suggest the buyers are working on forcing a breakout.
That won’t be easy, particularly given how overbought Twitter shares are since the bottom made in early 2017. But, the pattern that has taken shape thus far isn’t atypical of initial public offerings. Every one has to fall apart sooner than later, but most everyone eventually shrugs it off and works its way into a bullish mode.
The bigger-picture in only evident through the long-term lens of the weekly chart, framed by light blue lines. The upper boundary of that pattern currently rests at $44.70.
Zooming into the daily chart another wedge becomes evident. Framed by red dashed lines, a rising trading range has materialized. There’s still room for wide swings though.
Since May, the gray 100-day moving average line and the purple 50-day line have both stepped up as technical support.
Although it’s not ideal, the weekly chart also suggests a pretty good cup-and-handle pattern. The brimline, of course, is the ceiling that connects all the major peaks going back to mid-2014.
Lowe’s (LOW)

Lowe’s shares haven’t made a straight line to their current price since finding a bottom in 2009. In fact, there has been nothing straight about LOW stock for years. But, a well-established bullish trend line has kept the overarching advance intact. The up/down action, in fact, has been oddly reliable for years.
Something has changed just within the past few weeks, however, that could finally snap the winning streak. On the other hand, that would require one final but significant technical floor to buckle. The stock could reach that inflection point sometime as early as this week.
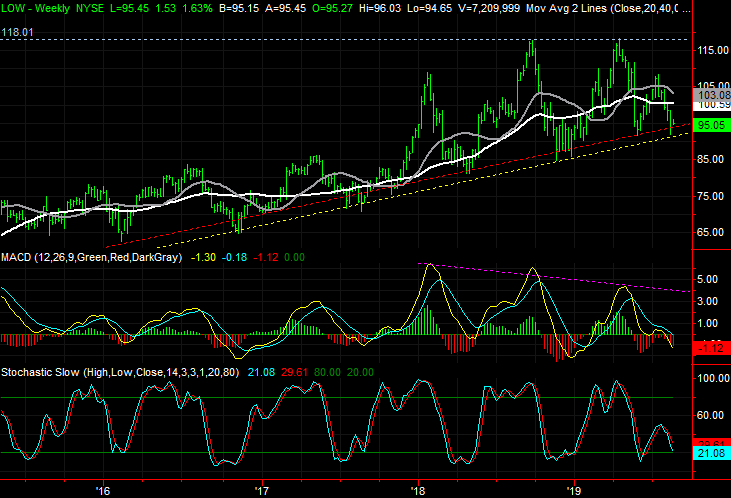
It’s evident on both stock charts, but more perspective is seen on the weekly chart. That is, Lowe’s shares brushed a long-standing floor last week, marked in yellow and tried to push up and off of it.
Although that has been where LOW stock has bounced every pullback thus far, in July, shares made their first lower high in years. That happened the first time after Lowe’s shares failed to move above a major peak. That’s the horizontal ceiling around $118, marked in blue on both stock charts.
It’s subtle, but telling that each MACD peak and subsequent crossunder since the beginning of 2018 has been lower than the last. That points to fading bullish efforts.
Procter & Gamble (PG)

At the beginning of 2018, most investors had doubts about Procter & Gamble. Although relatively new, David Taylor was capable, but it appeared the company might be beyond anybody’s help.
The tide turned in a convincing way by the middle of last year though, resulting in a rebound effort that has been tightly defined by a narrow trading range. Although overbought and ripe for a pullback, until it’s clear the lower boundary of that range is no longer holding up, the advance has to be respected. That’s especially true given the circumstances that have taken shape of late.
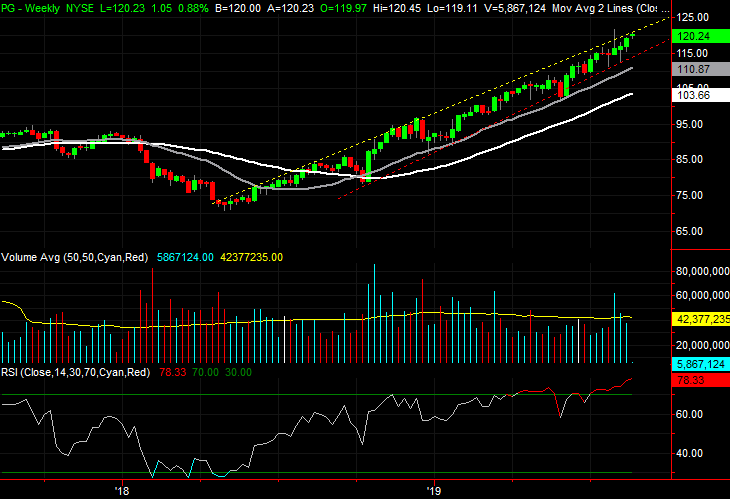
The rising trading range is marked with a yellow line on top and a red line on the bottom of both stock charts. It has poked above the ceiling a couple of times, and bumped it yesterday.
The weekly chart offers some needed perspective, but it also shows us something fairly new. That is, the RSI indicator is now deep into overbought territory, thanks to an unusually persistent advance.
Although the 70% gain since mid-2018 leaves P&G shares vulnerable to a pullback, that doesn’t inherently mean one will materialize. Notice that the weekly bullish volume bars are, for the most part, on the rise.
As of this writing, James Brumley did not hold a position in any of the aforementioned securities. You can learn more about him at his website jamesbrumley.com, or follow him on Twitter, at @jbrumley.
More From InvestorPlace
The post 3 Big Stock Charts for Tuesday: Twitter, Lowe’s and Procter & Gamble appeared first on InvestorPlace.
