Is 360 Capital Group Limited's (ASX:TGP) 1.1% ROE Worse Than Average?

While some investors are already well versed in financial metrics (hat tip), this article is for those who would like to learn about Return On Equity (ROE) and why it is important. We'll use ROE to examine 360 Capital Group Limited (ASX:TGP), by way of a worked example.
Over the last twelve months 360 Capital Group has recorded a ROE of 1.1%. That means that for every A$1 worth of shareholders' equity, it generated A$0.01 in profit.
Check out our latest analysis for 360 Capital Group
How Do I Calculate Return On Equity?
The formula for return on equity is:
Return on Equity = Net Profit (from continuing operations) ÷ Shareholders' Equity
Or for 360 Capital Group:
1.1% = AU$2.3m ÷ AU$203m (Based on the trailing twelve months to June 2019.)
Most readers would understand what net profit is, but it’s worth explaining the concept of shareholders’ equity. It is the capital paid in by shareholders, plus any retained earnings. The easiest way to calculate shareholders' equity is to subtract the company's total liabilities from the total assets.
What Does ROE Mean?
Return on Equity measures a company's profitability against the profit it has kept for the business (plus any capital injections). The 'return' is the profit over the last twelve months. A higher profit will lead to a higher ROE. So, all else being equal, a high ROE is better than a low one. That means it can be interesting to compare the ROE of different companies.
Does 360 Capital Group Have A Good ROE?
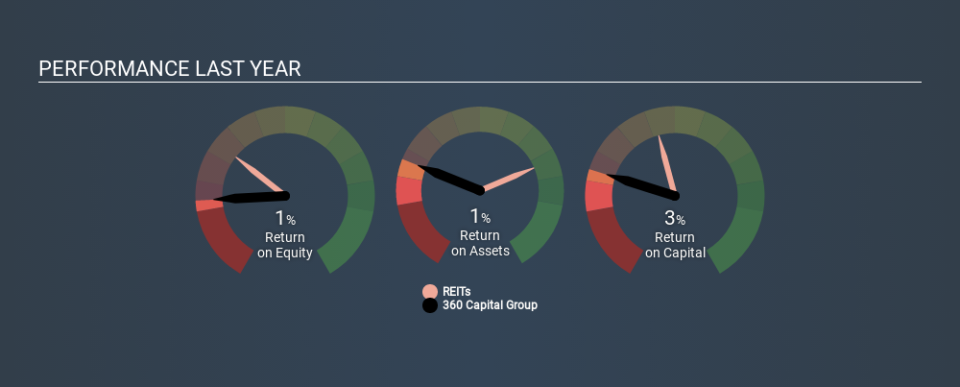
By comparing a company's ROE with its industry average, we can get a quick measure of how good it is. However, this method is only useful as a rough check, because companies do differ quite a bit within the same industry classification. As is clear from the image below, 360 Capital Group has a lower ROE than the average (7.7%) in the REITs industry.
That's not what we like to see. We prefer it when the ROE of a company is above the industry average, but it's not the be-all and end-all if it is lower. Still, shareholders might want to check if insiders have been selling.
Why You Should Consider Debt When Looking At ROE
Companies usually need to invest money to grow their profits. That cash can come from retained earnings, issuing new shares (equity), or debt. In the first two cases, the ROE will capture this use of capital to grow. In the latter case, the debt used for growth will improve returns, but won't affect the total equity. Thus the use of debt can improve ROE, albeit along with extra risk in the case of stormy weather, metaphorically speaking.
360 Capital Group's Debt And Its 1.1% ROE
Shareholders will be pleased to learn that 360 Capital Group has not one iota of net debt! So while I find its ROE to be rather low, at least it didn't use debt. After all, when a company has a strong balance sheet, it can often find ways to invest in growth, even if it takes some time.
But It's Just One Metric
Return on equity is a useful indicator of the ability of a business to generate profits and return them to shareholders. A company that can achieve a high return on equity without debt could be considered a high quality business. All else being equal, a higher ROE is better.
Having said that, while ROE is a useful indicator of business quality, you'll have to look at a whole range of factors to determine the right price to buy a stock. Profit growth rates, versus the expectations reflected in the price of the stock, are a particularly important to consider. So you might want to take a peek at this data-rich interactive graph of forecasts for the company.
But note: 360 Capital Group may not be the best stock to buy. So take a peek at this free list of interesting companies with high ROE and low debt.
If you spot an error that warrants correction, please contact the editor at editorial-team@simplywallst.com. This article by Simply Wall St is general in nature. It does not constitute a recommendation to buy or sell any stock, and does not take account of your objectives, or your financial situation. Simply Wall St has no position in the stocks mentioned.
We aim to bring you long-term focused research analysis driven by fundamental data. Note that our analysis may not factor in the latest price-sensitive company announcements or qualitative material. Thank you for reading.

