These 4 Measures Indicate That Bharat Dynamics (NSE:BDL) Is Using Debt Reasonably Well

Howard Marks put it nicely when he said that, rather than worrying about share price volatility, 'The possibility of permanent loss is the risk I worry about... and every practical investor I know worries about. So it seems the smart money knows that debt - which is usually involved in bankruptcies - is a very important factor, when you assess how risky a company is. As with many other companies Bharat Dynamics Limited (NSE:BDL) makes use of debt. But the real question is whether this debt is making the company risky.
When Is Debt Dangerous?
Generally speaking, debt only becomes a real problem when a company can't easily pay it off, either by raising capital or with its own cash flow. Part and parcel of capitalism is the process of 'creative destruction' where failed businesses are mercilessly liquidated by their bankers. However, a more usual (but still expensive) situation is where a company must dilute shareholders at a cheap share price simply to get debt under control. By replacing dilution, though, debt can be an extremely good tool for businesses that need capital to invest in growth at high rates of return. The first step when considering a company's debt levels is to consider its cash and debt together.
Check out our latest analysis for Bharat Dynamics
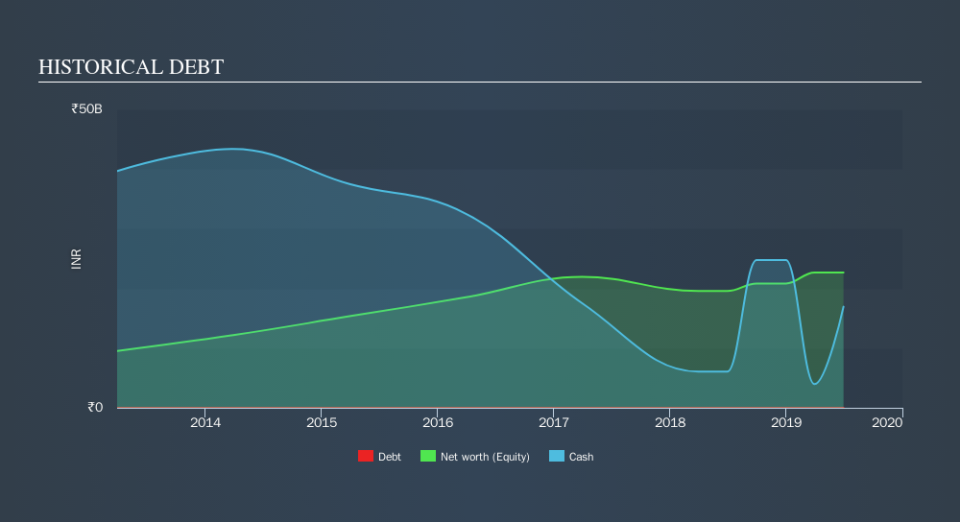
How Much Debt Does Bharat Dynamics Carry?
The image below, which you can click on for greater detail, shows that at March 2019 Bharat Dynamics had debt of ₹18.2m, up from none in one year. But on the other hand it also has ₹16.9b in cash, leading to a ₹16.9b net cash position.
A Look At Bharat Dynamics's Liabilities
The latest balance sheet data shows that Bharat Dynamics had liabilities of ₹29.2b due within a year, and liabilities of ₹2.81b falling due after that. Offsetting this, it had ₹16.9b in cash and ₹19.6b in receivables that were due within 12 months. So it can boast ₹4.52b more liquid assets than total liabilities.
This surplus suggests that Bharat Dynamics has a conservative balance sheet, and could probably eliminate its debt without much difficulty. Simply put, the fact that Bharat Dynamics has more cash than debt is arguably a good indication that it can manage its debt safely.
On the other hand, Bharat Dynamics's EBIT dived 14%, over the last year. We think hat kind of performance, if repeated frequently, could well lead to difficulties for the stock. There's no doubt that we learn most about debt from the balance sheet. But you can't view debt in total isolation; since Bharat Dynamics will need earnings to service that debt. So if you're keen to discover more about its earnings, it might be worth checking out this graph of its long term earnings trend.
But our final consideration is also important, because a company cannot pay debt with paper profits; it needs cold hard cash. Bharat Dynamics may have net cash on the balance sheet, but it is still interesting to look at how well the business converts its earnings before interest and tax (EBIT) to free cash flow, because that will influence both its need for, and its capacity to manage debt. Over the last three years, Bharat Dynamics saw substantial negative free cash flow, in total. While that may be a result of expenditure for growth, it does make the debt far more risky.
Summing up
While it is always sensible to investigate a company's debt, in this case Bharat Dynamics has ₹16.9b in net cash and a decent-looking balance sheet. So we are not troubled with Bharat Dynamics's debt use. Above most other metrics, we think its important to track how fast earnings per share is growing, if at all. If you've also come to that realization, you're in luck, because today you can view this interactive graph of Bharat Dynamics's earnings per share history for free.
At the end of the day, it's often better to focus on companies that are free from net debt. You can access our special list of such companies (all with a track record of profit growth). It's free.
We aim to bring you long-term focused research analysis driven by fundamental data. Note that our analysis may not factor in the latest price-sensitive company announcements or qualitative material.
If you spot an error that warrants correction, please contact the editor at editorial-team@simplywallst.com. This article by Simply Wall St is general in nature. It does not constitute a recommendation to buy or sell any stock, and does not take account of your objectives, or your financial situation. Simply Wall St has no position in the stocks mentioned. Thank you for reading.
