These 4 Measures Indicate That Godfrey Phillips India (NSE:GODFRYPHLP) Is Using Debt Safely

Warren Buffett famously said, 'Volatility is far from synonymous with risk.' When we think about how risky a company is, we always like to look at its use of debt, since debt overload can lead to ruin. We can see that Godfrey Phillips India Limited (NSE:GODFRYPHLP) does use debt in its business. But should shareholders be worried about its use of debt?
When Is Debt A Problem?
Debt is a tool to help businesses grow, but if a business is incapable of paying off its lenders, then it exists at their mercy. In the worst case scenario, a company can go bankrupt if it cannot pay its creditors. However, a more frequent (but still costly) occurrence is where a company must issue shares at bargain-basement prices, permanently diluting shareholders, just to shore up its balance sheet. Of course, the upside of debt is that it often represents cheap capital, especially when it replaces dilution in a company with the ability to reinvest at high rates of return. When we examine debt levels, we first consider both cash and debt levels, together.
See our latest analysis for Godfrey Phillips India
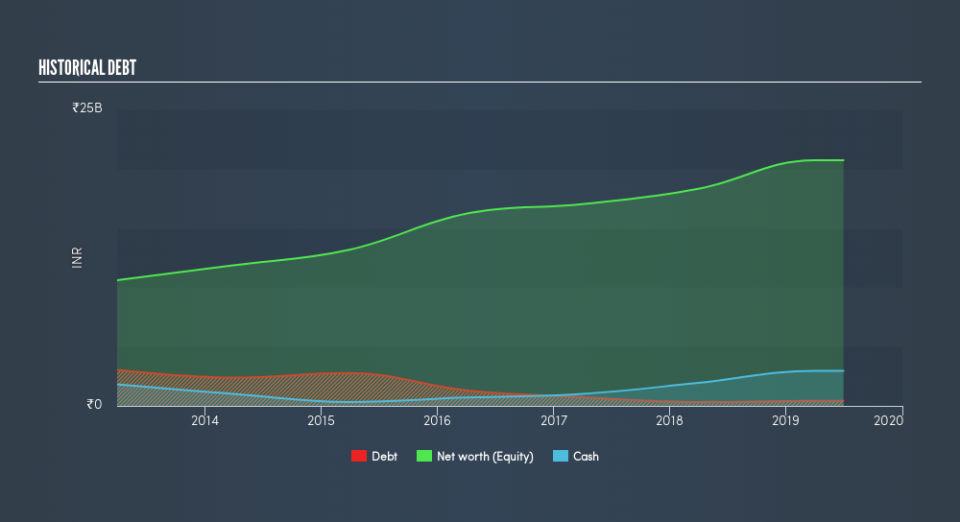
What Is Godfrey Phillips India's Debt?
As you can see below, at the end of March 2019, Godfrey Phillips India had ₹420.0m of debt, up from ₹326.3m a year ago. Click the image for more detail. But on the other hand it also has ₹2.96b in cash, leading to a ₹2.54b net cash position.
A Look At Godfrey Phillips India's Liabilities
The latest balance sheet data shows that Godfrey Phillips India had liabilities of ₹7.38b due within a year, and liabilities of ₹575.5m falling due after that. Offsetting this, it had ₹2.96b in cash and ₹700.2m in receivables that were due within 12 months. So its liabilities outweigh the sum of its cash and (near-term) receivables by ₹4.29b.
Of course, Godfrey Phillips India has a market capitalization of ₹54.8b, so these liabilities are probably manageable. However, we do think it is worth keeping an eye on its balance sheet strength, as it may change over time. While it does have liabilities worth noting, Godfrey Phillips India also has more cash than debt, so we're pretty confident it can manage its debt safely.
On top of that, Godfrey Phillips India grew its EBIT by 97% over the last twelve months, and that growth will make it easier to handle its debt. When analysing debt levels, the balance sheet is the obvious place to start. But it is Godfrey Phillips India's earnings that will influence how the balance sheet holds up in the future. So when considering debt, it's definitely worth looking at the earnings trend. Click here for an interactive snapshot.
Finally, a business needs free cash flow to pay off debt; accounting profits just don't cut it. Godfrey Phillips India may have net cash on the balance sheet, but it is still interesting to look at how well the business converts its earnings before interest and tax (EBIT) to free cash flow, because that will influence both its need for, and its capacity to manage debt. During the last three years, Godfrey Phillips India generated free cash flow amounting to a very robust 92% of its EBIT, more than we'd expect. That puts it in a very strong position to pay down debt.
Summing up
We could understand if investors are concerned about Godfrey Phillips India's liabilities, but we can be reassured by the fact it has has net cash of ₹2.5b. And it impressed us with free cash flow of ₹4.5b, being 92% of its EBIT. So is Godfrey Phillips India's debt a risk? It doesn't seem so to us. Over time, share prices tend to follow earnings per share, so if you're interested in Godfrey Phillips India, you may well want to click here to check an interactive graph of its earnings per share history.
When all is said and done, sometimes its easier to focus on companies that don't even need debt. Readers can access a list of growth stocks with zero net debt 100% free, right now.
We aim to bring you long-term focused research analysis driven by fundamental data. Note that our analysis may not factor in the latest price-sensitive company announcements or qualitative material.
If you spot an error that warrants correction, please contact the editor at editorial-team@simplywallst.com. This article by Simply Wall St is general in nature. It does not constitute a recommendation to buy or sell any stock, and does not take account of your objectives, or your financial situation. Simply Wall St has no position in the stocks mentioned. Thank you for reading.

