These 4 Measures Indicate That Opsens (TSE:OPS) Is Using Debt Reasonably Well
Some say volatility, rather than debt, is the best way to think about risk as an investor, but Warren Buffett famously said that 'Volatility is far from synonymous with risk.' When we think about how risky a company is, we always like to look at its use of debt, since debt overload can lead to ruin. Importantly, Opsens Inc. (TSE:OPS) does carry debt. But the real question is whether this debt is making the company risky.
Why Does Debt Bring Risk?
Debt assists a business until the business has trouble paying it off, either with new capital or with free cash flow. If things get really bad, the lenders can take control of the business. However, a more usual (but still expensive) situation is where a company must dilute shareholders at a cheap share price simply to get debt under control. Of course, debt can be an important tool in businesses, particularly capital heavy businesses. When we think about a company's use of debt, we first look at cash and debt together.
View our latest analysis for Opsens
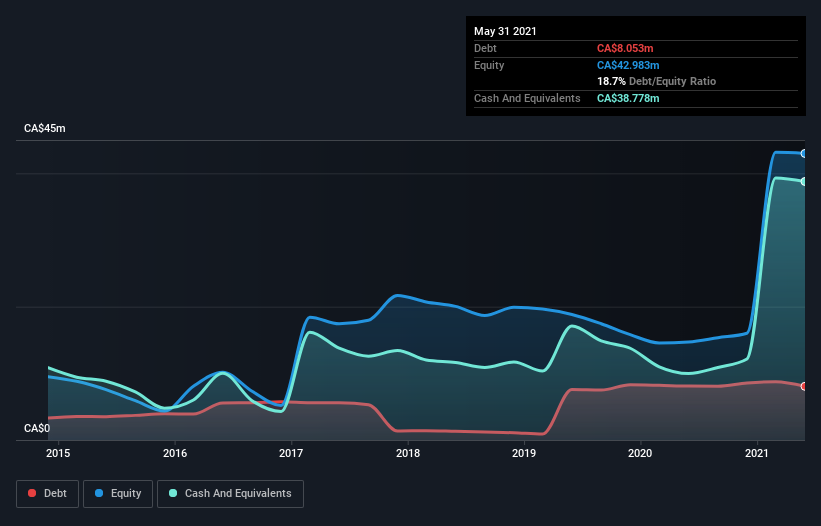
How Much Debt Does Opsens Carry?
As you can see below, Opsens had CA$8.05m of debt, at May 2021, which is about the same as the year before. You can click the chart for greater detail. However, its balance sheet shows it holds CA$38.8m in cash, so it actually has CA$30.7m net cash.
How Strong Is Opsens' Balance Sheet?
The latest balance sheet data shows that Opsens had liabilities of CA$7.57m due within a year, and liabilities of CA$9.63m falling due after that. On the other hand, it had cash of CA$38.8m and CA$5.46m worth of receivables due within a year. So it can boast CA$27.0m more liquid assets than total liabilities.
This short term liquidity is a sign that Opsens could probably pay off its debt with ease, as its balance sheet is far from stretched. Simply put, the fact that Opsens has more cash than debt is arguably a good indication that it can manage its debt safely.
We also note that Opsens improved its EBIT from a last year's loss to a positive CA$389k. When analysing debt levels, the balance sheet is the obvious place to start. But it is future earnings, more than anything, that will determine Opsens's ability to maintain a healthy balance sheet going forward. So if you want to see what the professionals think, you might find this free report on analyst profit forecasts to be interesting.
Finally, a company can only pay off debt with cold hard cash, not accounting profits. Opsens may have net cash on the balance sheet, but it is still interesting to look at how well the business converts its earnings before interest and tax (EBIT) to free cash flow, because that will influence both its need for, and its capacity to manage debt. Happily for any shareholders, Opsens actually produced more free cash flow than EBIT over the last year. That sort of strong cash conversion gets us as excited as the crowd when the beat drops at a Daft Punk concert.
Summing up
While it is always sensible to investigate a company's debt, in this case Opsens has CA$30.7m in net cash and a decent-looking balance sheet. And it impressed us with free cash flow of CA$2.9m, being 750% of its EBIT. So we don't think Opsens's use of debt is risky. When analysing debt levels, the balance sheet is the obvious place to start. However, not all investment risk resides within the balance sheet - far from it. We've identified 3 warning signs with Opsens , and understanding them should be part of your investment process.
If, after all that, you're more interested in a fast growing company with a rock-solid balance sheet, then check out our list of net cash growth stocks without delay.
This article by Simply Wall St is general in nature. We provide commentary based on historical data and analyst forecasts only using an unbiased methodology and our articles are not intended to be financial advice. It does not constitute a recommendation to buy or sell any stock, and does not take account of your objectives, or your financial situation. We aim to bring you long-term focused analysis driven by fundamental data. Note that our analysis may not factor in the latest price-sensitive company announcements or qualitative material. Simply Wall St has no position in any stocks mentioned.
Have feedback on this article? Concerned about the content? Get in touch with us directly. Alternatively, email editorial-team (at) simplywallst.com.
