These 4 Measures Indicate That Resilux (EBR:RES) Is Using Debt Extensively

Warren Buffett famously said, 'Volatility is far from synonymous with risk.' So it might be obvious that you need to consider debt, when you think about how risky any given stock is, because too much debt can sink a company. As with many other companies Resilux NV (EBR:RES) makes use of debt. But is this debt a concern to shareholders?
When Is Debt A Problem?
Debt is a tool to help businesses grow, but if a business is incapable of paying off its lenders, then it exists at their mercy. In the worst case scenario, a company can go bankrupt if it cannot pay its creditors. However, a more common (but still painful) scenario is that it has to raise new equity capital at a low price, thus permanently diluting shareholders. Of course, debt can be an important tool in businesses, particularly capital heavy businesses. When we think about a company's use of debt, we first look at cash and debt together.
View our latest analysis for Resilux
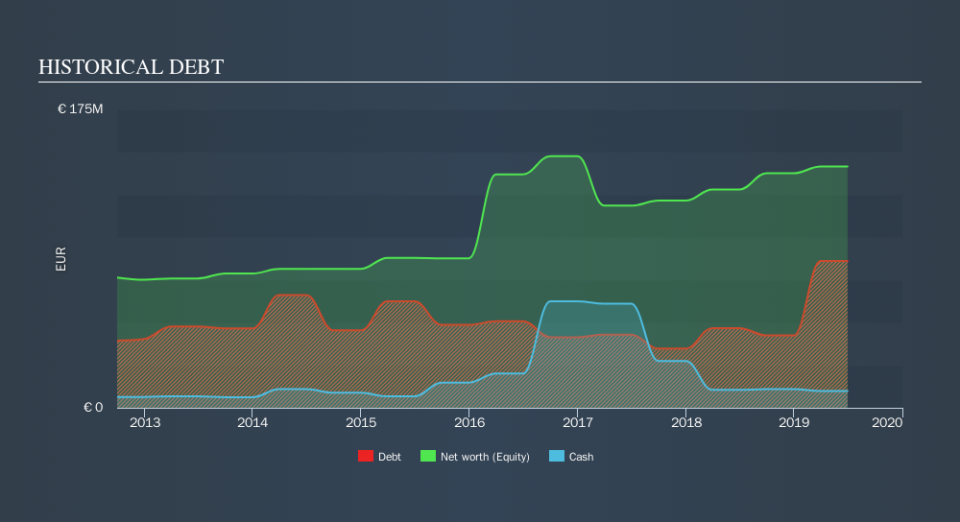
What Is Resilux's Net Debt?
The image below, which you can click on for greater detail, shows that at June 2019 Resilux had debt of €86.0m, up from €46.7m in one year. On the flip side, it has €9.89m in cash leading to net debt of about €76.1m.
How Strong Is Resilux's Balance Sheet?
The latest balance sheet data shows that Resilux had liabilities of €140.3m due within a year, and liabilities of €29.9m falling due after that. Offsetting these obligations, it had cash of €9.89m as well as receivables valued at €68.3m due within 12 months. So it has liabilities totalling €92.1m more than its cash and near-term receivables, combined.
While this might seem like a lot, it is not so bad since Resilux has a market capitalization of €267.3m, and so it could probably strengthen its balance sheet by raising capital if it needed to. But it's clear that we should definitely closely examine whether it can manage its debt without dilution.
We use two main ratios to inform us about debt levels relative to earnings. The first is net debt divided by earnings before interest, tax, depreciation, and amortization (EBITDA), while the second is how many times its earnings before interest and tax (EBIT) covers its interest expense (or its interest cover, for short). The advantage of this approach is that we take into account both the absolute quantum of debt (with net debt to EBITDA) and the actual interest expenses associated with that debt (with its interest cover ratio).
Resilux's net debt to EBITDA ratio of about 1.8 suggests only moderate use of debt. And its strong interest cover of 16.2 times, makes us even more comfortable. Resilux grew its EBIT by 8.1% in the last year. That's far from incredible but it is a good thing, when it comes to paying off debt. There's no doubt that we learn most about debt from the balance sheet. But it is future earnings, more than anything, that will determine Resilux's ability to maintain a healthy balance sheet going forward. So if you want to see what the professionals think, you might find this free report on analyst profit forecasts to be interesting.
Finally, a company can only pay off debt with cold hard cash, not accounting profits. So we clearly need to look at whether that EBIT is leading to corresponding free cash flow. Over the last two years, Resilux saw substantial negative free cash flow, in total. While investors are no doubt expecting a reversal of that situation in due course, it clearly does mean its use of debt is more risky.
Our View
Resilux's conversion of EBIT to free cash flow and level of total liabilities definitely weigh on it, in our esteem. But its interest cover tells a very different story, and suggests some resilience. Looking at all the angles mentioned above, it does seem to us that Resilux is a somewhat risky investment as a result of its debt. That's not necessarily a bad thing, since leverage can boost returns on equity, but it is something to be aware of. Above most other metrics, we think its important to track how fast earnings per share is growing, if at all. If you've also come to that realization, you're in luck, because today you can view this interactive graph of Resilux's earnings per share history for free.
At the end of the day, it's often better to focus on companies that are free from net debt. You can access our special list of such companies (all with a track record of profit growth). It's free.
We aim to bring you long-term focused research analysis driven by fundamental data. Note that our analysis may not factor in the latest price-sensitive company announcements or qualitative material.
If you spot an error that warrants correction, please contact the editor at editorial-team@simplywallst.com. This article by Simply Wall St is general in nature. It does not constitute a recommendation to buy or sell any stock, and does not take account of your objectives, or your financial situation. Simply Wall St has no position in the stocks mentioned. Thank you for reading.
