52-Week Company Lows
According to GuruFocus' calculations, these Guru stocks have reached their 52-week lows.
Eli Lilly and Co. reached the 52-week low of $108.36
The price of Eli Lilly and Co. (NYSE:LLY) shares has declined to close to the 52-week low of $108.36, which is 21.2% off the 52-week high of $132.13. The company has a market cap of $104.61 billion.
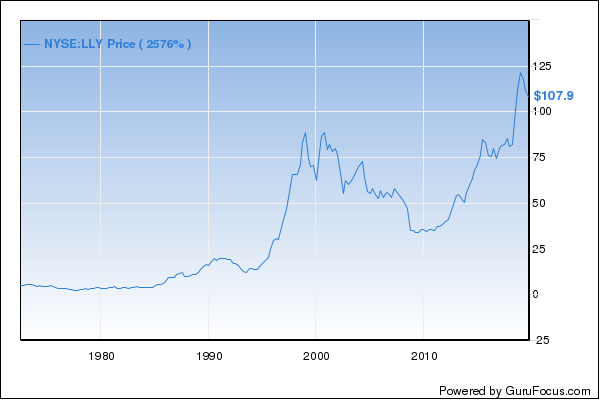
Its shares traded with a price-earnings ratio of 13.67 and a price-sales ratio of 4.61 as of Oct. 11. The trailing 12-month dividend yield is 2.30%. The forward dividend yield is 2.38%. The company had an annual average earnings growth of 20.00% over the past 10 years.
Eli Lilly is a pharmaceutical company with a focus on neuroscience, endocrinology, oncology and immunology. Lilly's key products include Alimta for cancer; Forteo for osteoporosis; Jardiance, Trulicity, Humalog, and Humulin for diabetes; and Cialis for erectile dysfunction. Lilly also holds a strong position in the animal healthcare market.
In the second quarter of 2019, net income was $1.33 billion compared with a net loss of $259.9 million in the second quarter of 2018.
10% Owner Lilly Endowment Inc. sold 210,000 shares on Sept. 20 at a price of $116.37. The price of the stock has decreased by 6.88% since then.
Senior Vice President and President of Lilly International Alfonso G. Zulueta sold 4,500 shares on Sept. 20 at a price of $117. Since then, the price of the stock has decreased by 7.38%.
DuPont de Nemours reached the 52-week low of $65.16
The price of DuPont de Nemours Inc. (NYSE:DD) shares has declined to close to the 52-week low of $65.16, which is 27.7% off the 52-week high of $86.93. The company has a market cap of $48.58 billion.

Its shares traded with a price-earnings ratio of 54.03 and a price-sales ratio of 0.76 as of Oct. 11. The trailing 12-month dividend yield is 4.60%. The forward dividend yield is 1.84%. The company had an annual average earnings growth of 2.10% over the past 10 years.
DowDuPont is a diversified global chemicals and materials company that was formed from the merger of Dow Chemical and DuPont. Its portfolio includes basic chemicals, agriculture, automotive, electronics and communication, construction, health care and safety and protection. The company also sells genetically modified seeds, making it one of the most prominent global seed providers. By the end of 2019, DowDuPont plans to split into three separate companies--one company each in agriculture, material sciences and specialty products.
The net loss for the second quarter was $537 million, compared to net income of $1.80 billion for the prior-year period.
Simon Property Group reached the 52-week low of $148.60
The price of Simon Property Group Inc. (NYSE:SPG) shares has declined to close to the 52-week low of $148.60, which is 24.1% off the 52-week high of $191.49. The company has a market cap of $45.77 billion.
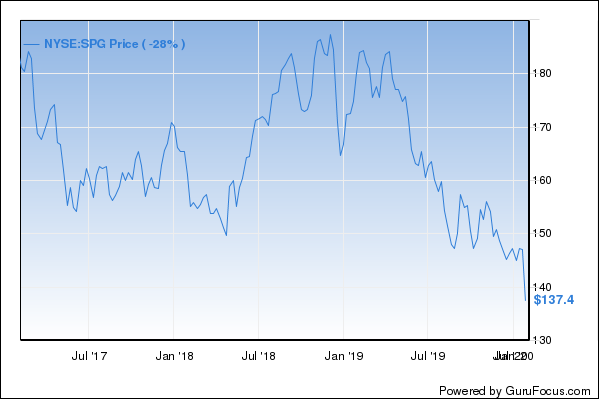
Its shares traded with a price-earnings ratio of 19.86 and a price-sales ratio of 8.03 as of Oct. 11. The trailing 12-month dividend yield is 5.52%. The forward dividend yield is 5.65%. The company had an annual average earnings growth of 4.90% over the past 10 years.
Simon Property Group is the largest retail U.S. real estate investment trust, with distinct platforms for its upscale regional malls, premium outlet centers and international properties.
Net income for the second quarter of 2019 was $495.3 million, down from $547.0 million in the comparable period of 2018.
EOG Resources reached the 52-week low of $69.25
The price of EOG Resources Inc. (NYSE:EOG) shares has declined to close to the 52-week low of $69.25, which is 45.7% off the 52-week high of $125.48. The company has a market cap of $40.21 billion.
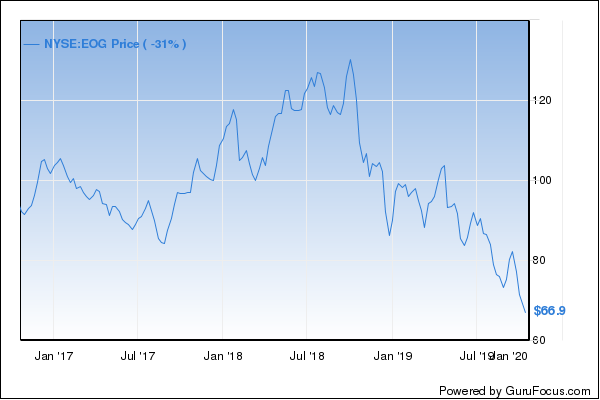
Its shares traded with a price-earnings ratio of 11.26 and a price-sales ratio of 3.32 as of Oct. 11. The trailing 12-month dividend yield is 1.37%. The forward dividend yield is 1.66%.
EOG Resources is an oil and gas producer with acreage in several U.S. shale plays, including the Permian Basin, the Eagle Ford and the Bakken. At the end of 2017, it reported net proved reserves of 2.5 billion barrels of oil equivalent. Net production averaged 609 thousand barrels of oil equivalent per day in 2017, at a ratio of 70% oil and natural gas liquids and 30% natural gas.
Net income for the second quarter of 2019 was $848 million compared with $697 million for the second quarter of 2018.
Occidental Petroleum reached the 52-week low of $41.12
The price of Occidental Petroleum Corp. (NYSE:OXY) shares has declined to close to the 52-week low of $41.12, which is 48.0% off the 52-week high of $77.84. The company has a market cap of $36.78 billion.
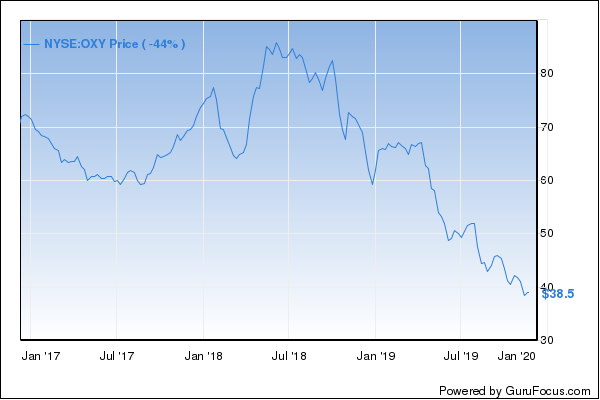
Its shares traded with a price-earnings ratio of 8.12 and a price-sales ratio of 1.69 as of Oct. 11. The trailing 12-month dividend yield is 7.61%. The forward dividend yield is 7.68%.
Occidental Petroleum is an independent exploration and production company with operations in the U.S., Latin America and the Middle East. At the end of 2017, the company reported net proven reserves of 2.6 billion barrels of oil equivalent. Net production averaged 601,000 barrels of oil equivalent per day in 2017, at a ratio of 25% oil and NGLs and 25% natural gas.
Net income for the second quarter of 2019 was $635 million compared to $848 million for the second quarter of 2018.
Director William R. Klesse bought 5,000 shares on Sept. 27 at a price of $45.54. The price of the stock has decreased by 9.71% since then.
Carnival Corp. reached the 52-week low of $41.55
The price of Carnival Corp. (NYSE:CCL) shares has declined to close to the 52-week low of $41.55, which is 36.1% off the 52-week high of $62.52. The company has a market cap of $29.61 billion.
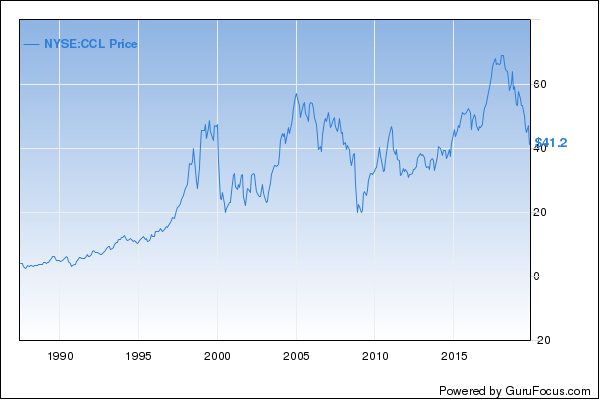
Its shares traded with a price-earnings ratio of 9.41 and a price-sales ratio of 1.41 as of Oct. 11. The trailing 12-month dividend yield is 4.81%. The forward dividend yield is 4.81%. The company had an annual average earnings growth of 4.30% over the past 10 years.
Carnival Corp. and Carnival PLC (CUK) operate a dual-listed company, where the businesses of each are combined and operate as one economic entity. Carnival is the largest global cruise company, with more than 100 ships on the seas. Its portfolio of brands includes Carnival Cruise Lines, Holland America, Princess Cruises and Seabourn in North America; P&O Cruises and Cunard Line in the U.K.; Aida in Germany; Costa Cruises in Southern Europe; P&O Cruises in Australia; and Fathom, supporting impact travel. Carnival also owns Holland America Princess Alaska Tours in Alaska and the Canadian Yukon. Carnival's brands attract more than 12 million guests annually.
Net income was $451 million for the second quarter of 2019 compared to net income of $561 million for the second quarter of 2018.
Director Sir Jonathon Band sold 5,000 shares on Oct. 3 at a price of $40.83. Since then, the price of the stock has increased by 1.76%.
Go here for the complete list of 52-week lows.
Disclosure: I do not own stock in any of the companies mentioned in the article.
Read more here:
Weekly CEO Buys Highlight
52-Week Company Lows
Weekly CEO Buys Highlight
Not a Premium Member of GuruFocus? Sign up for a free 7-day trial here
This article first appeared on GuruFocus.
