6 Charts That Show How China's Economy Has Recovered From The Coronavirus
By Erik Norland
Prior to the pandemic, China’s official data showed many years of stable growth ranging from 6.2% to 7.5% year on year, rarely missing the consensus estimate by more than 0.1%. That is no longer the case. On October 19, investors learned that China’s economy expanded by 4.9% in Q3 2020. Although the number was 0.6% below consensus, it was an improvement on the 3.2% growth in Q2 and -6.8% in Q1. So far this year, overall growth in the world’s second largest economy is just 0.7% versus the same three quarters in 2019, about one-tenth its usual pace of expansion.
Looking past the headline number reveals several important but easily overlooked trends, some of which are encouraging and others not:
China’s industrial sector is booming, expanding at around 8-9% per year (Figure 1).
By contrast, overall growth at only 4.9% YoY in Q3 implies that China’s service sector remains stagnant.
Debt levels are soaring. So far in 2020, household debt as a percentage of GDP has risen from 55.8% to 61.4%; non-financial corporate debt has increased from 150.3% to 163.4%, and public sector debt has risen from 38.1% to 44.4%. China’s overall level of leverage has risen from 244.3% to 269.2% according to China’s National Bureau of Statistics and the People’s Bank of China.
China’s imports are strong, but exports are weakening.
Figure 1: Industrial growth has been 8-9% YoY but overall GDP just +4.9% YoY in Q3
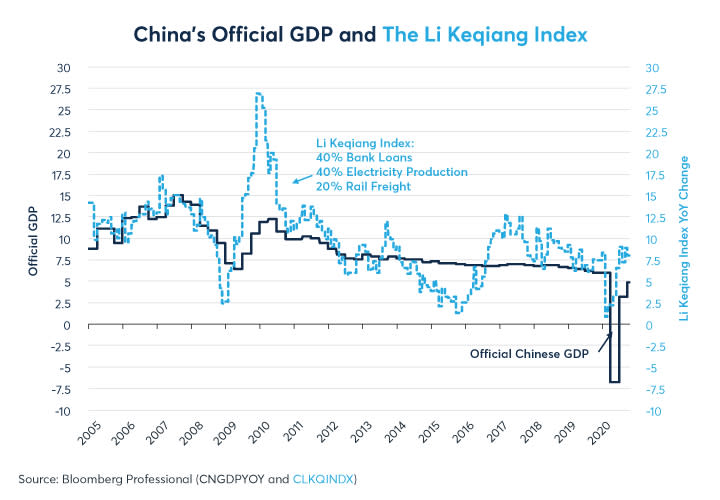
Overall, the GDP numbers, taken in the context of the other data such as the industrially focused Li Keqiang index, indicate that China, like much of the world, is experiencing a K-shaped recovery - where one branch ascends while the other descends. In China, as elsewhere in the world, the ascending branch includes those who can telecommute to work. Additionally, China’s industrial sector, perhaps more than anywhere else, is moving upward at about the same pace as before.
The descending part of the K includes just about everything else: exports, employees who must show up to work in person, notably in the service sector, and the country’s large population of domestic migrant workers. Overall, Q3 GDP paints a picture of a service economy that is not fully back to normal.
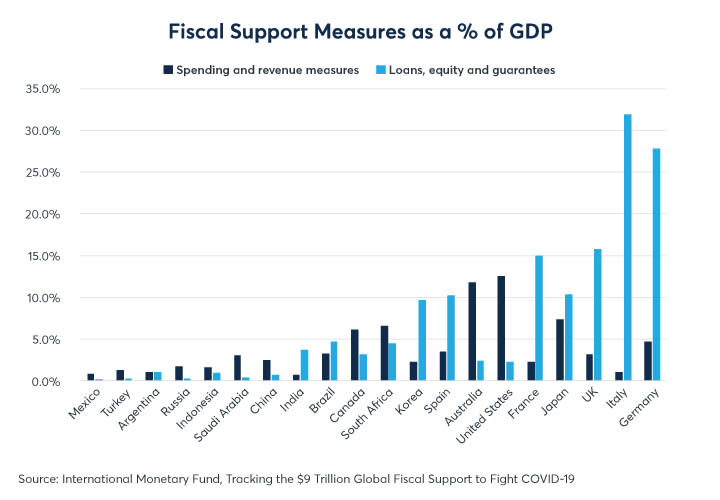
The debt portion of the picture is also troubling. In 2009, when debt levels were much lower (140% of GDP), China engineered an economic boom by encouraging businesses to invest in capital projects, taking on large amounts of debt in the process. This time around, the reason for the rise in debt is less clear. The People’s Bank of China (PBoC) has eased lending standards slightly but has done little in the way of lowering interest rates (Figure 2). Moreover, China’s fiscal stimulus is much less robust than elsewhere in the world (Figure 3). One reason why debt could be increasing as a ratio of GDP is because the denominator has stopped expanding rather than the numerator expanding unusually fast. This is to say that, unlike in 2009 during which debt levels soared to ignite growth, debt is now growing at a rather ordinary pace but ratios are expanding because GDP growth has stalled.
Figure 2: The PBoC has not eased lending standards or cut rates much since the pandemic began
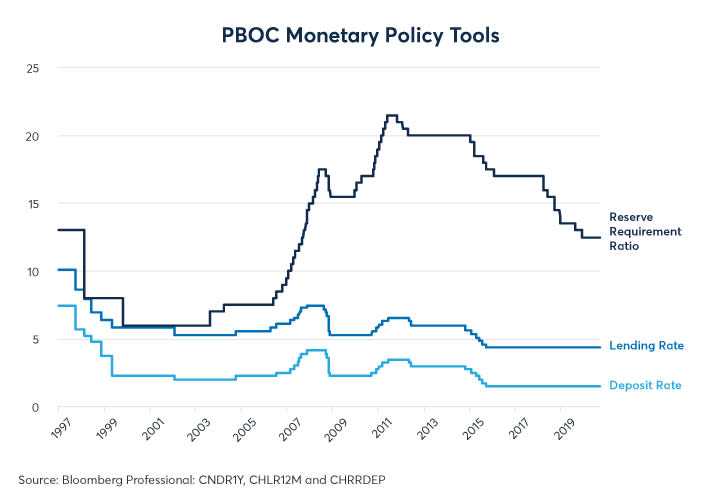
Figure 3: China’s fiscal support measures have been modest compared to Europe, Japan and the US
Overall, this paints a worrisome picture for the Chinese economy. With the pandemic’s resurgence in Europe and North America, there is every reason to think that export demand will remain soft for at least another six months, if not longer. Moreover, China’s domestic growth is uneven and has been fueled by rising levels of debt. Yet, global markets don’t seem overly concerned. Perhaps this is because commodity prices have shown a strong correlation with China’s industrial sector. The Li Keqiang index, which measures rail freight volume, electricity consumption and bank loans, has demonstrated a high correlation with prices of many commodities and currencies over the past 15 years.
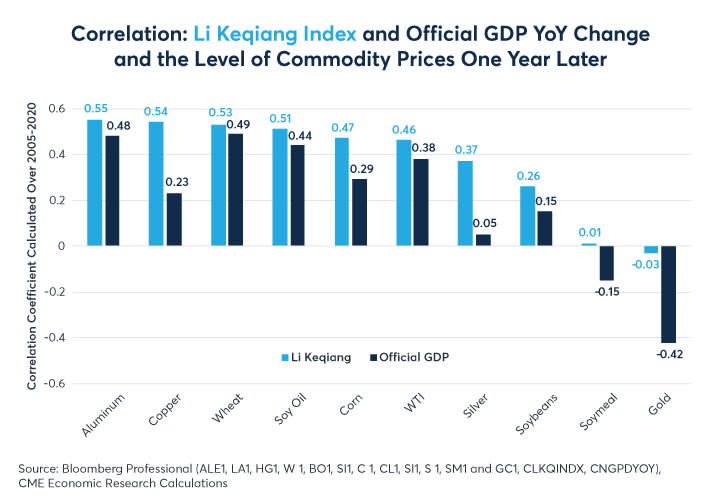
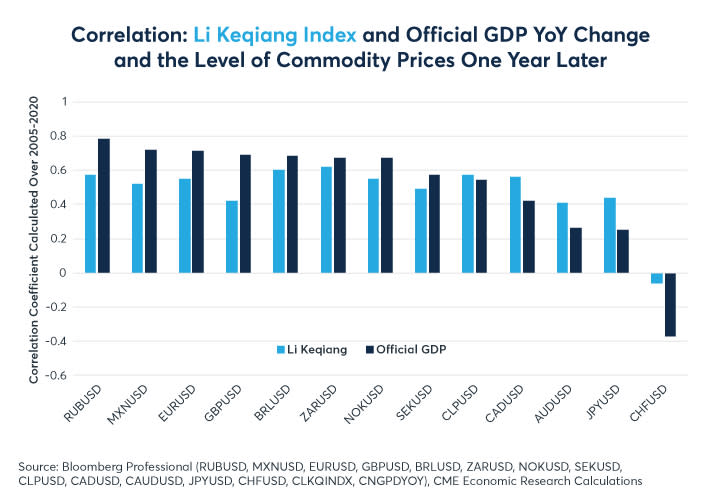
Figure 4 shows the correlation between the year-on-year change in the Li Keqiang index and the level of various commodity prices one year later. Over the past 15 years, the index has often been a good leading indicator of future price levels of certain commodities including copper, wheat, soy oil, corn, crude oil and to a lesser extent silver, a precious metal with many industrial applications. The index, however, has been less reliable for commodities such as soybeans, soy meal and gold.
While there is no guarantee that the Li Keqiang index will remain a meaningful indicator going forward, the rebound in China’s industrial growth, for which the index can be seen as a proxy, has coincided with a rebound in many commodity prices over the past six months. As such, the index could be an indicator of whether China’s industrial expansion is slowing because of weak demand from end users domestically or internationally. Indeed, international demand for Chinese industrial goods has been supported by the global fiscal and monetary easing, but the willingness of foreign governments to continue running such large fiscal deficits cannot be taken for granted.
What is remarkable also about the data in figure 4 is that commodities have had a more positive correlation with the Li Keqiang index than they do with China’s official GDP. This could be the result of the index being a more focused measure of China’s industrial health, which is more relevant to industrial metals and other commodities than the state of China’s services sector.
Figure 4: Li Keqiang versus official GDP as one-year forward indictors of commodity price levels
The Li Keqiang index, and to an even greater extent official GDP, has also correlated highly with future movements in currencies versus the U.S. dollar. When Chinese growth is strong, non-U.S. dollar currencies often rallied over the next 12 months. When Chinese growth is weak, the U.S. dollar (USD) often reached higher levels over the subsequent year (Figure 5).
Figure 5: Stronger growth in China often means stronger FX versus USD over the past 15 years.
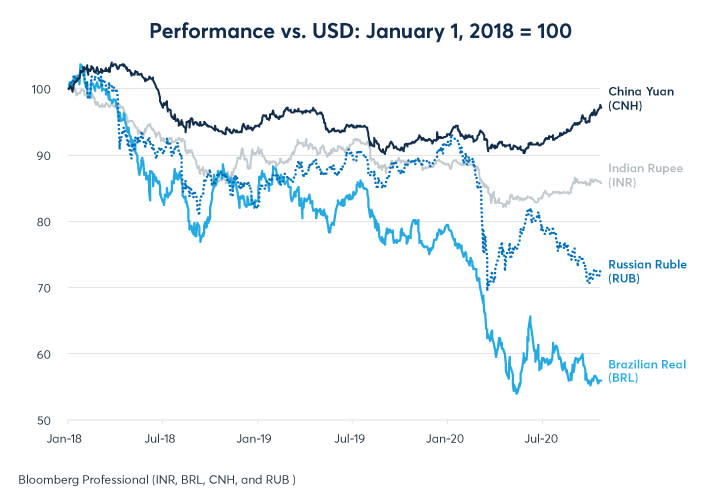
For the moment, the Chinese currency has been doing well versus the U.S. dollar and most other emerging market currencies. This may reflect China reopening its economy sooner than most other nations as well as the continuing economic distress felt in many countries (Figure 6). That said, the yuan’s continued strength may depend on the ability of China to keep growing despite weak external demand, a still impaired domestic services sector, and soaring debt ratios. Moreover, if history is any guide, any slowdown in China’s economy could also be bearish for commodity prices and send investors fleeing to the U.S. dollar. By contrast, continued economic growth in China might boost commodity prices and foreign currencies as it often has in the past.
Figure 6: CNH has been strong relative to other EM currencies since the pandemic struck
Bottom Line
China’s economy grew 4.9% in Q3, 0.6% below consensus
China’s debt levels are soaring across all categories, public and private
China’s industrial sector is strong but its services sector has been weak
Since 2005, China’s industrial sector has been a decent forward indicator of certain commodity prices
China’s growth has also correlated positively with the trading levels of many currencies versus the U.S. dollar
If China slows because of internal imbalances or lack of external demand, that could be bearish for commodity prices and bullish for USD
To learn more about futures and options, go to Benzinga’s futures and options education resource.
See more from Benzinga
Options Trades For This Crazy Market: Get Benzinga Options to Follow High-Conviction Trade Ideas
How Many People Are Going On Airplanes, Subways, And Out To Eat During The Pandemic?
© 2020 Benzinga.com. Benzinga does not provide investment advice. All rights reserved.
