Do A2B Australia Limited’s (ASX:A2B) Returns On Capital Employed Make The Cut?

Today we are going to look at A2B Australia Limited (ASX:A2B) to see whether it might be an attractive investment prospect. To be precise, we'll consider its Return On Capital Employed (ROCE), as that will inform our view of the quality of the business.
First, we'll go over how we calculate ROCE. Then we'll compare its ROCE to similar companies. And finally, we'll look at how its current liabilities are impacting its ROCE.
Understanding Return On Capital Employed (ROCE)
ROCE measures the amount of pre-tax profits a company can generate from the capital employed in its business. In general, businesses with a higher ROCE are usually better quality. Overall, it is a valuable metric that has its flaws. Renowned investment researcher Michael Mauboussin has suggested that a high ROCE can indicate that 'one dollar invested in the company generates value of more than one dollar'.
So, How Do We Calculate ROCE?
The formula for calculating the return on capital employed is:
Return on Capital Employed = Earnings Before Interest and Tax (EBIT) ÷ (Total Assets - Current Liabilities)
Or for A2B Australia:
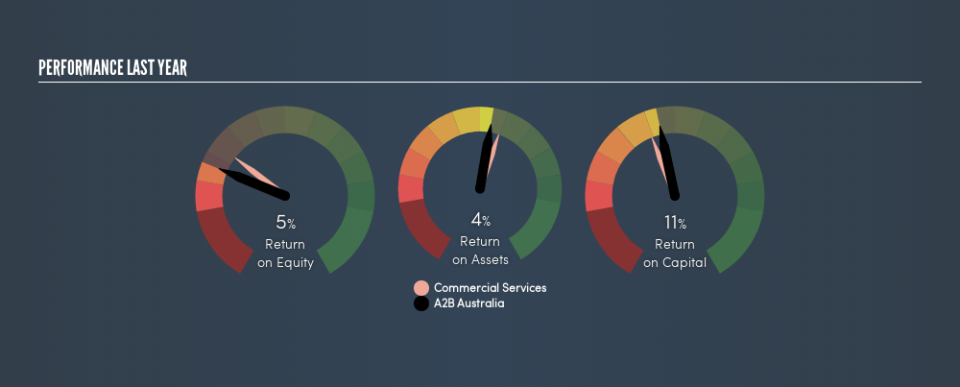
0.11 = AU$17m ÷ (AU$208m - AU$44m) (Based on the trailing twelve months to December 2018.)
Therefore, A2B Australia has an ROCE of 11%.
View our latest analysis for A2B Australia
Is A2B Australia's ROCE Good?
One way to assess ROCE is to compare similar companies. It appears that A2B Australia's ROCE is fairly close to the Commercial Services industry average of 12%. Separate from A2B Australia's performance relative to its industry, its ROCE in absolute terms looks satisfactory, and it may be worth researching in more depth.
When considering this metric, keep in mind that it is backwards looking, and not necessarily predictive. Companies in cyclical industries can be difficult to understand using ROCE, as returns typically look high during boom times, and low during busts. This is because ROCE only looks at one year, instead of considering returns across a whole cycle. Future performance is what matters, and you can see analyst predictions in our free report on analyst forecasts for the company.
A2B Australia's Current Liabilities And Their Impact On Its ROCE
Short term (or current) liabilities, are things like supplier invoices, overdrafts, or tax bills that need to be paid within 12 months. Due to the way the ROCE equation works, having large bills due in the near term can make it look as though a company has less capital employed, and thus a higher ROCE than usual. To check the impact of this, we calculate if a company has high current liabilities relative to its total assets.
A2B Australia has total liabilities of AU$44m and total assets of AU$208m. Therefore its current liabilities are equivalent to approximately 21% of its total assets. Current liabilities are minimal, limiting the impact on ROCE.
Our Take On A2B Australia's ROCE
With that in mind, A2B Australia's ROCE appears pretty good. A2B Australia looks strong on this analysis, but there are plenty of other companies that could be a good opportunity . Here is a free list of companies growing earnings rapidly.
If you like to buy stocks alongside management, then you might just love this free list of companies. (Hint: insiders have been buying them).
We aim to bring you long-term focused research analysis driven by fundamental data. Note that our analysis may not factor in the latest price-sensitive company announcements or qualitative material.
If you spot an error that warrants correction, please contact the editor at editorial-team@simplywallst.com. This article by Simply Wall St is general in nature. It does not constitute a recommendation to buy or sell any stock, and does not take account of your objectives, or your financial situation. Simply Wall St has no position in the stocks mentioned. Thank you for reading.
