Here’s What Aegon N.V.’s (AMS:AGN) P/E Is Telling Us

This article is for investors who would like to improve their understanding of price to earnings ratios (P/E ratios). We’ll show how you can use Aegon N.V.’s (AMS:AGN) P/E ratio to inform your assessment of the investment opportunity. Aegon has a price to earnings ratio of 14.88, based on the last twelve months. That corresponds to an earnings yield of approximately 6.7%.
Check out our latest analysis for Aegon
Want to participate in a research study? Help shape the future of investing tools and earn a $60 gift card!
How Do You Calculate A P/E Ratio?
The formula for P/E is:
Price to Earnings Ratio = Price per Share ÷ Earnings per Share (EPS)
Or for Aegon:
P/E of 14.88 = €4.32 ÷ €0.29 (Based on the year to December 2018.)
Is A High Price-to-Earnings Ratio Good?
A higher P/E ratio implies that investors pay a higher price for the earning power of the business. That is not a good or a bad thing per se, but a high P/E does imply buyers are optimistic about the future.
How Growth Rates Impact P/E Ratios
Probably the most important factor in determining what P/E a company trades on is the earnings growth. When earnings grow, the ‘E’ increases, over time. That means even if the current P/E is high, it will reduce over time if the share price stays flat. A lower P/E should indicate the stock is cheap relative to others — and that may attract buyers.
Aegon’s earnings per share fell by 74% in the last twelve months. But it has grown its earnings per share by 25% per year over the last five years.
How Does Aegon’s P/E Ratio Compare To Its Peers?
The P/E ratio indicates whether the market has higher or lower expectations of a company. You can see in the image below that the average P/E (12.3) for companies in the insurance industry is lower than Aegon’s P/E.
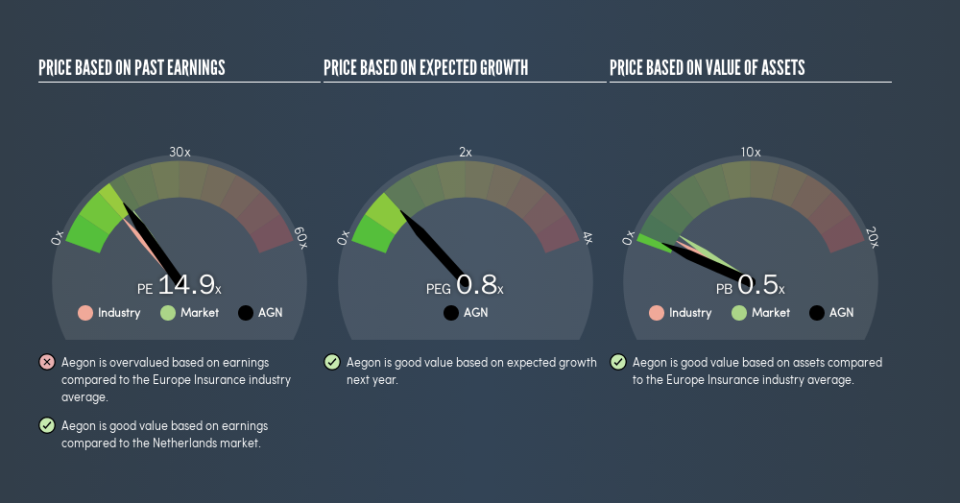
That means that the market expects Aegon will outperform other companies in its industry. The market is optimistic about the future, but that doesn’t guarantee future growth. So further research is always essential. I often monitor director buying and selling.
Don’t Forget: The P/E Does Not Account For Debt or Bank Deposits
It’s important to note that the P/E ratio considers the market capitalization, not the enterprise value. In other words, it does not consider any debt or cash that the company may have on the balance sheet. Theoretically, a business can improve its earnings (and produce a lower P/E in the future), by taking on debt (or spending its remaining cash).
Such expenditure might be good or bad, in the long term, but the point here is that the balance sheet is not reflected by this ratio.
Is Debt Impacting Aegon’s P/E?
Aegon’s net debt is 55% of its market cap. If you want to compare its P/E ratio to other companies, you should absolutely keep in mind it has significant borrowings.
The Verdict On Aegon’s P/E Ratio
Aegon has a P/E of 14.9. That’s around the same as the average in the NL market, which is 15.9. With meaningful debt, and no earnings per share growth last year, even an average P/E indicates that the market a significant improvement from the business.
When the market is wrong about a stock, it gives savvy investors an opportunity. As value investor Benjamin Graham famously said, ‘In the short run, the market is a voting machine but in the long run, it is a weighing machine.’ So this free report on the analyst consensus forecasts could help you make a master move on this stock.
Of course you might be able to find a better stock than Aegon. So you may wish to see this free collection of other companies that have grown earnings strongly.
We aim to bring you long-term focused research analysis driven by fundamental data. Note that our analysis may not factor in the latest price-sensitive company announcements or qualitative material.
If you spot an error that warrants correction, please contact the editor at editorial-team@simplywallst.com. This article by Simply Wall St is general in nature. It does not constitute a recommendation to buy or sell any stock, and does not take account of your objectives, or your financial situation. Simply Wall St has no position in the stocks mentioned. Thank you for reading.
