Do You Like Alimentation Couche-Tard Inc. (TSE:ATD.B) At This P/E Ratio?

This article is written for those who want to get better at using price to earnings ratios (P/E ratios). To keep it practical, we'll show how Alimentation Couche-Tard Inc.'s (TSE:ATD.B) P/E ratio could help you assess the value on offer. Looking at earnings over the last twelve months, Alimentation Couche-Tard has a P/E ratio of 18.48. That means that at current prices, buyers pay CA$18.48 for every CA$1 in trailing yearly profits.
See our latest analysis for Alimentation Couche-Tard
How Do You Calculate Alimentation Couche-Tard's P/E Ratio?
The formula for price to earnings is:
Price to Earnings Ratio = Share Price (in reporting currency) ÷ Earnings per Share (EPS)
Or for Alimentation Couche-Tard:
P/E of 18.48 = CA$33.14 (Note: this is the share price in the reporting currency, namely, USD ) ÷ CA$1.79 (Based on the year to October 2019.)
Is A High Price-to-Earnings Ratio Good?
A higher P/E ratio means that investors are paying a higher price for each CA$1 of company earnings. That isn't necessarily good or bad, but a high P/E implies relatively high expectations of what a company can achieve in the future.
How Does Alimentation Couche-Tard's P/E Ratio Compare To Its Peers?
The P/E ratio essentially measures market expectations of a company. If you look at the image below, you can see Alimentation Couche-Tard has a lower P/E than the average (21.4) in the consumer retailing industry classification.
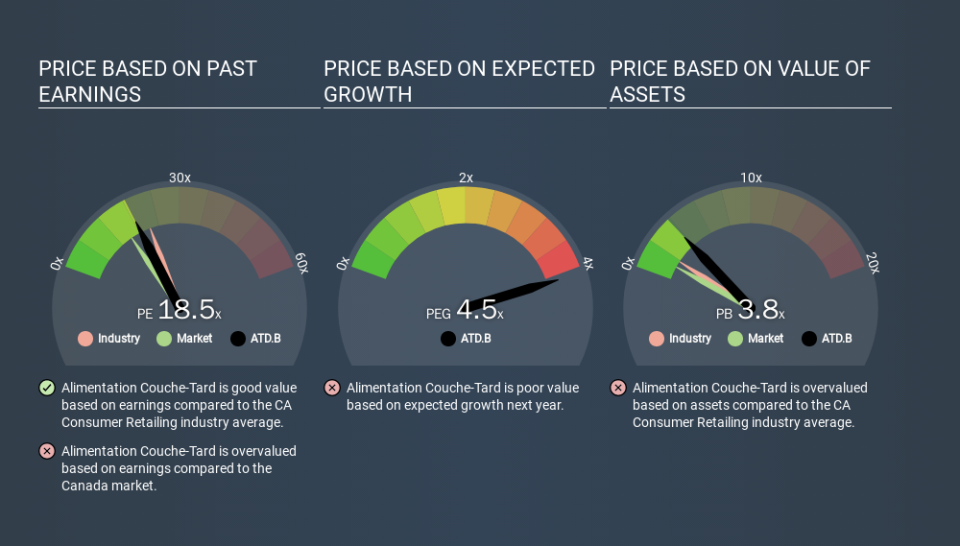
This suggests that market participants think Alimentation Couche-Tard will underperform other companies in its industry. While current expectations are low, the stock could be undervalued if the situation is better than the market assumes. You should delve deeper. I like to check if company insiders have been buying or selling.
How Growth Rates Impact P/E Ratios
P/E ratios primarily reflect market expectations around earnings growth rates. Earnings growth means that in the future the 'E' will be higher. And in that case, the P/E ratio itself will drop rather quickly. And as that P/E ratio drops, the company will look cheap, unless its share price increases.
Most would be impressed by Alimentation Couche-Tard earnings growth of 12% in the last year. And earnings per share have improved by 18% annually, over the last five years. So one might expect an above average P/E ratio.
Don't Forget: The P/E Does Not Account For Debt or Bank Deposits
The 'Price' in P/E reflects the market capitalization of the company. In other words, it does not consider any debt or cash that the company may have on the balance sheet. In theory, a company can lower its future P/E ratio by using cash or debt to invest in growth.
Such expenditure might be good or bad, in the long term, but the point here is that the balance sheet is not reflected by this ratio.
Alimentation Couche-Tard's Balance Sheet
Alimentation Couche-Tard has net debt worth 15% of its market capitalization. This could bring some additional risk, and reduce the number of investment options for management; worth remembering if you compare its P/E to businesses without debt.
The Bottom Line On Alimentation Couche-Tard's P/E Ratio
Alimentation Couche-Tard has a P/E of 18.5. That's higher than the average in its market, which is 15.3. While the company does use modest debt, its recent earnings growth is very good. Therefore, it's not particularly surprising that it has a above average P/E ratio.
Investors have an opportunity when market expectations about a stock are wrong. As value investor Benjamin Graham famously said, 'In the short run, the market is a voting machine but in the long run, it is a weighing machine. So this free visualization of the analyst consensus on future earnings could help you make the right decision about whether to buy, sell, or hold.
You might be able to find a better buy than Alimentation Couche-Tard. If you want a selection of possible winners, check out this free list of interesting companies that trade on a P/E below 20 (but have proven they can grow earnings).
If you spot an error that warrants correction, please contact the editor at editorial-team@simplywallst.com. This article by Simply Wall St is general in nature. It does not constitute a recommendation to buy or sell any stock, and does not take account of your objectives, or your financial situation. Simply Wall St has no position in the stocks mentioned.
We aim to bring you long-term focused research analysis driven by fundamental data. Note that our analysis may not factor in the latest price-sensitive company announcements or qualitative material. Thank you for reading.
