Alphageo (India) Limited (NSE:ALPHAGEO) Earns Among The Best Returns In Its Industry

Today we are going to look at Alphageo (India) Limited (NSE:ALPHAGEO) to see whether it might be an attractive investment prospect. In particular, we'll consider its Return On Capital Employed (ROCE), as that can give us insight into how profitably the company is able to employ capital in its business.
First up, we'll look at what ROCE is and how we calculate it. Then we'll compare its ROCE to similar companies. Then we'll determine how its current liabilities are affecting its ROCE.
Understanding Return On Capital Employed (ROCE)
ROCE measures the 'return' (pre-tax profit) a company generates from capital employed in its business. Generally speaking a higher ROCE is better. Overall, it is a valuable metric that has its flaws. Renowned investment researcher Michael Mauboussin has suggested that a high ROCE can indicate that 'one dollar invested in the company generates value of more than one dollar'.
So, How Do We Calculate ROCE?
The formula for calculating the return on capital employed is:
Return on Capital Employed = Earnings Before Interest and Tax (EBIT) ÷ (Total Assets - Current Liabilities)
Or for Alphageo (India):
0.25 = ₹703m ÷ (₹4.0b - ₹1.2b) (Based on the trailing twelve months to March 2019.)
Therefore, Alphageo (India) has an ROCE of 25%.
See our latest analysis for Alphageo (India)
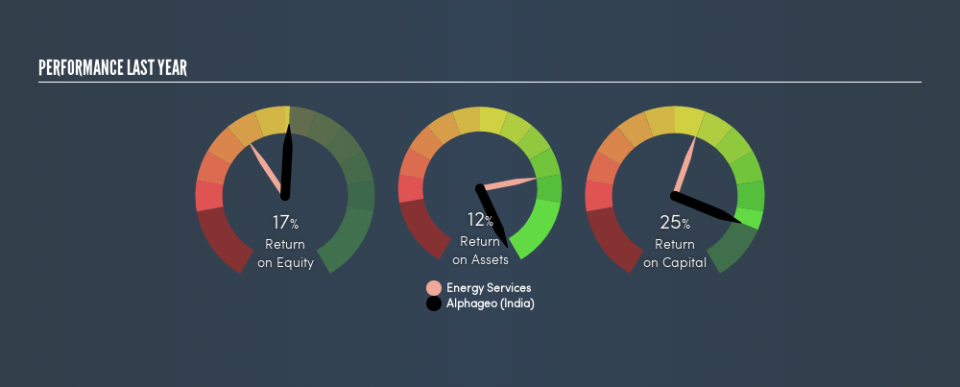
Does Alphageo (India) Have A Good ROCE?
ROCE can be useful when making comparisons, such as between similar companies. In our analysis, Alphageo (India)'s ROCE is meaningfully higher than the 13% average in the Energy Services industry. We consider this a positive sign, because it suggests it uses capital more efficiently than similar companies. Regardless of where Alphageo (India) sits next to its industry, its ROCE in absolute terms appears satisfactory, and this company could be worth a closer look.
In our analysis, Alphageo (India)'s ROCE appears to be 25%, compared to 3 years ago, when its ROCE was 14%. This makes us think about whether the company has been reinvesting shrewdly. You can click on the image below to see (in greater detail) how Alphageo (India)'s past growth compares to other companies.
It is important to remember that ROCE shows past performance, and is not necessarily predictive. ROCE can be misleading for companies in cyclical industries, with returns looking impressive during the boom times, but very weak during the busts. ROCE is only a point-in-time measure. Given the industry it operates in, Alphageo (India) could be considered cyclical. You can check if Alphageo (India) has cyclical profits by looking at this free graph of past earnings, revenue and cash flow.
Alphageo (India)'s Current Liabilities And Their Impact On Its ROCE
Short term (or current) liabilities, are things like supplier invoices, overdrafts, or tax bills that need to be paid within 12 months. Due to the way ROCE is calculated, a high level of current liabilities makes a company look as though it has less capital employed, and thus can (sometimes unfairly) boost the ROCE. To counter this, investors can check if a company has high current liabilities relative to total assets.
Alphageo (India) has total liabilities of ₹1.2b and total assets of ₹4.0b. As a result, its current liabilities are equal to approximately 31% of its total assets. Alphageo (India) has a medium level of current liabilities, which would boost the ROCE.
What We Can Learn From Alphageo (India)'s ROCE
Alphageo (India)'s ROCE does look good, but the level of current liabilities also contribute to that. Alphageo (India) looks strong on this analysis, but there are plenty of other companies that could be a good opportunity . Here is a free list of companies growing earnings rapidly.
If you like to buy stocks alongside management, then you might just love this free list of companies. (Hint: insiders have been buying them).
We aim to bring you long-term focused research analysis driven by fundamental data. Note that our analysis may not factor in the latest price-sensitive company announcements or qualitative material.
If you spot an error that warrants correction, please contact the editor at editorial-team@simplywallst.com. This article by Simply Wall St is general in nature. It does not constitute a recommendation to buy or sell any stock, and does not take account of your objectives, or your financial situation. Simply Wall St has no position in the stocks mentioned. Thank you for reading.
