Apollo Hospitals Enterprise Limited’s (NSE:APOLLOHOSP) Investment Returns Are Lagging Its Industry

Today we are going to look at Apollo Hospitals Enterprise Limited (NSE:APOLLOHOSP) to see whether it might be an attractive investment prospect. Specifically, we're going to calculate its Return On Capital Employed (ROCE), in the hopes of getting some insight into the business.
First of all, we'll work out how to calculate ROCE. Then we'll compare its ROCE to similar companies. Last but not least, we'll look at what impact its current liabilities have on its ROCE.
Understanding Return On Capital Employed (ROCE)
ROCE measures the amount of pre-tax profits a company can generate from the capital employed in its business. In general, businesses with a higher ROCE are usually better quality. Ultimately, it is a useful but imperfect metric. Renowned investment researcher Michael Mauboussin has suggested that a high ROCE can indicate that 'one dollar invested in the company generates value of more than one dollar'.
How Do You Calculate Return On Capital Employed?
The formula for calculating the return on capital employed is:
Return on Capital Employed = Earnings Before Interest and Tax (EBIT) ÷ (Total Assets - Current Liabilities)
Or for Apollo Hospitals Enterprise:
0.092 = ₹6.7b ÷ (₹92b - ₹20b) (Based on the trailing twelve months to March 2019.)
Therefore, Apollo Hospitals Enterprise has an ROCE of 9.2%.
View our latest analysis for Apollo Hospitals Enterprise
Is Apollo Hospitals Enterprise's ROCE Good?
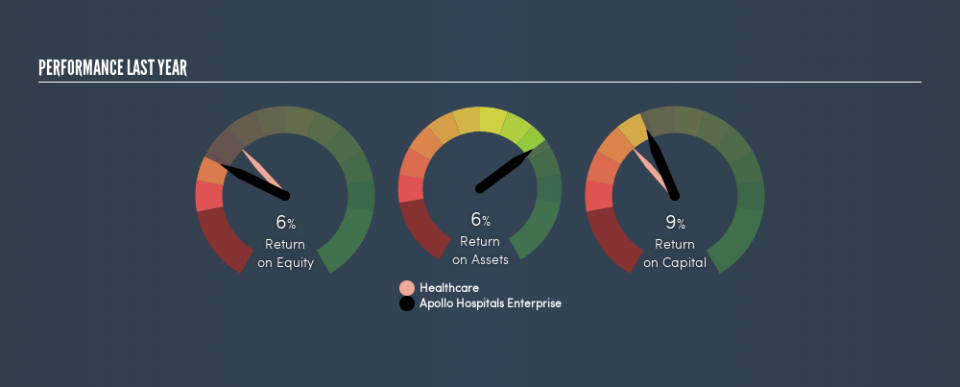
ROCE can be useful when making comparisons, such as between similar companies. We can see Apollo Hospitals Enterprise's ROCE is meaningfully below the Healthcare industry average of 14%. This could be seen as a negative, as it suggests some competitors may be employing their capital more efficiently. Putting aside Apollo Hospitals Enterprise's performance relative to its industry, its ROCE in absolute terms is poor - considering the risk of owning stocks compared to government bonds. There are potentially more appealing investments elsewhere.
We can see that , Apollo Hospitals Enterprise currently has an ROCE of 9.2% compared to its ROCE 3 years ago, which was 7.0%. This makes us think the business might be improving. You can see in the image below how Apollo Hospitals Enterprise's ROCE compares to its industry. Click to see more on past growth.
When considering ROCE, bear in mind that it reflects the past and does not necessarily predict the future. ROCE can be misleading for companies in cyclical industries, with returns looking impressive during the boom times, but very weak during the busts. ROCE is only a point-in-time measure. Since the future is so important for investors, you should check out our free report on analyst forecasts for Apollo Hospitals Enterprise.
Apollo Hospitals Enterprise's Current Liabilities And Their Impact On Its ROCE
Liabilities, such as supplier bills and bank overdrafts, are referred to as current liabilities if they need to be paid within 12 months. Due to the way the ROCE equation works, having large bills due in the near term can make it look as though a company has less capital employed, and thus a higher ROCE than usual. To counter this, investors can check if a company has high current liabilities relative to total assets.
Apollo Hospitals Enterprise has total liabilities of ₹20b and total assets of ₹92b. Therefore its current liabilities are equivalent to approximately 21% of its total assets. With a very reasonable level of current liabilities, so the impact on ROCE is fairly minimal.
The Bottom Line On Apollo Hospitals Enterprise's ROCE
That's not a bad thing, however Apollo Hospitals Enterprise has a weak ROCE and may not be an attractive investment. Of course, you might find a fantastic investment by looking at a few good candidates. So take a peek at this free list of companies with modest (or no) debt, trading on a P/E below 20.
If you are like me, then you will not want to miss this free list of growing companies that insiders are buying.
We aim to bring you long-term focused research analysis driven by fundamental data. Note that our analysis may not factor in the latest price-sensitive company announcements or qualitative material.
If you spot an error that warrants correction, please contact the editor at editorial-team@simplywallst.com. This article by Simply Wall St is general in nature. It does not constitute a recommendation to buy or sell any stock, and does not take account of your objectives, or your financial situation. Simply Wall St has no position in the stocks mentioned. Thank you for reading.
