Is Apollo Hospitals Enterprise Limited’s (NSE:APOLLOHOSP) Balance Sheet A Threat To Its Future?

Want to participate in a short research study? Help shape the future of investing tools and receive a $20 prize!
Mid-caps stocks, like Apollo Hospitals Enterprise Limited (NSE:APOLLOHOSP) with a market capitalization of ₹157b, aren’t the focus of most investors who prefer to direct their investments towards either large-cap or small-cap stocks. Surprisingly though, when accounted for risk, mid-caps have delivered better returns compared to the two other categories of stocks. Today we will look at APOLLOHOSP’s financial liquidity and debt levels, which are strong indicators for whether the company can weather economic downturns or fund strategic acquisitions for future growth. Note that this information is centred entirely on financial health and is a top-level understanding, so I encourage you to look further into APOLLOHOSP here.
Check out our latest analysis for Apollo Hospitals Enterprise
How much cash does APOLLOHOSP generate through its operations?
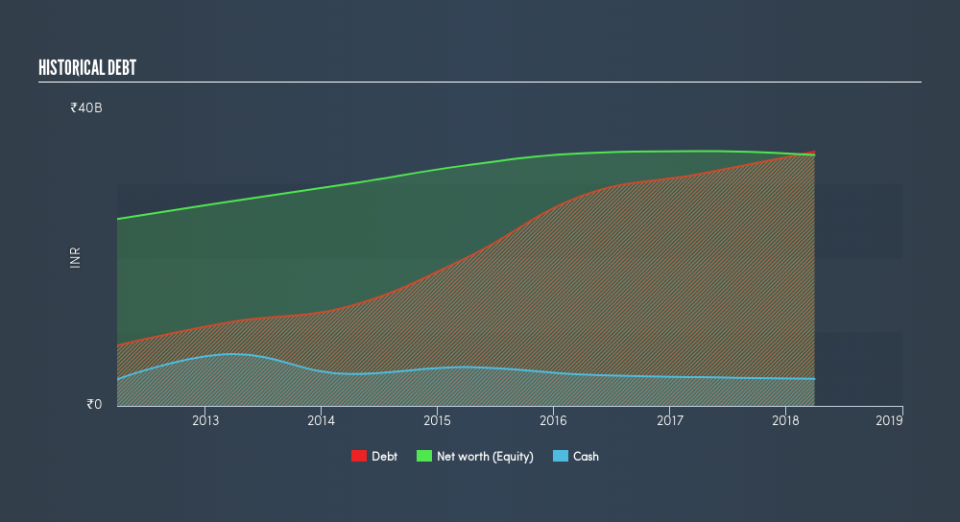
APOLLOHOSP has built up its total debt levels in the last twelve months, from ₹31b to ₹34b , which accounts for long term debt. With this rise in debt, the current cash and short-term investment levels stands at ₹3.6b , ready to deploy into the business. Moreover, APOLLOHOSP has produced cash from operations of ₹5.4b over the same time period, resulting in an operating cash to total debt ratio of 16%, signalling that APOLLOHOSP’s debt is not appropriately covered by operating cash. This ratio can also be interpreted as a measure of efficiency as an alternative to return on assets. In APOLLOHOSP’s case, it is able to generate 0.16x cash from its debt capital.
Can APOLLOHOSP meet its short-term obligations with the cash in hand?
With current liabilities at ₹16b, the company has been able to meet these commitments with a current assets level of ₹22b, leading to a 1.42x current account ratio. Usually, for Healthcare companies, this is a suitable ratio since there is a bit of a cash buffer without leaving too much capital in a low-return environment.
Does APOLLOHOSP face the risk of succumbing to its debt-load?
APOLLOHOSP is a highly-leveraged company with debt exceeding equity by over 100%. This is not unusual for mid-caps as debt tends to be a cheaper and faster source of funding for some businesses. We can test if APOLLOHOSP’s debt levels are sustainable by measuring interest payments against earnings of a company. Ideally, earnings before interest and tax (EBIT) should cover net interest by at least three times. For APOLLOHOSP, the ratio of 1.84x suggests that interest is not strongly covered, which means that debtors may be less inclined to loan the company more money, reducing its headroom for growth through debt.
Next Steps:
APOLLOHOSP’s high cash coverage means that, although its debt levels are high, the company is able to utilise its borrowings efficiently in order to generate cash flow. Since there is also no concerns around APOLLOHOSP’s liquidity needs, this may be its optimal capital structure for the time being. Keep in mind I haven’t considered other factors such as how APOLLOHOSP has been performing in the past. You should continue to research Apollo Hospitals Enterprise to get a more holistic view of the mid-cap by looking at:
Future Outlook: What are well-informed industry analysts predicting for APOLLOHOSP’s future growth? Take a look at our free research report of analyst consensus for APOLLOHOSP’s outlook.
Valuation: What is APOLLOHOSP worth today? Is the stock undervalued, even when its growth outlook is factored into its intrinsic value? The intrinsic value infographic in our free research report helps visualize whether APOLLOHOSP is currently mispriced by the market.
Other High-Performing Stocks: Are there other stocks that provide better prospects with proven track records? Explore our free list of these great stocks here.
We aim to bring you long-term focused research analysis driven by fundamental data. Note that our analysis may not factor in the latest price-sensitive company announcements or qualitative material.
If you spot an error that warrants correction, please contact the editor at editorial-team@simplywallst.com. This article by Simply Wall St is general in nature. It does not constitute a recommendation to buy or sell any stock, and does not take account of your objectives, or your financial situation. Simply Wall St has no position in the stocks mentioned. Thank you for reading.

