April Gold Reaction to $1806.10 Pivot Sets Tone into Close
Gold futures are trading lower shortly before the mid-session on Thursday, but hovering above a two-week low hit earlier in the session. Putting pressure on the precious metal for a second session are higher Treasury yields and a strong U.S. Dollar.
The catalysts that triggered the sell-off in gold are the Federal Reserve’s hawkish tone in yesterday’s policy statement as well as additional comments from Fed Chair Jerome Powell.
At 15:40 GMT, April Comex gold futures are trading $1807.40, down $24.60 or -1.34%. The SPDR Gold Shares ETF (GLD) is trading $167.78, down $2.01 or -1.18%.
On Wednesday, the Fed announced it would begin raising interest rates in March. That news was widely expected. However, Federal Reserve Chair Jerome Powell surprised investors by leaving the door open to larger and faster than expected interest rate hikes.
So far the reaction by gold traders has been textbook, but not particularly long-term bearish. That trend will be determined by how inflation reacts to the first rate hike and how aggressive the Fed will have to be in subsequent rate hikes.
Daily Swing Chart Technical Analysis
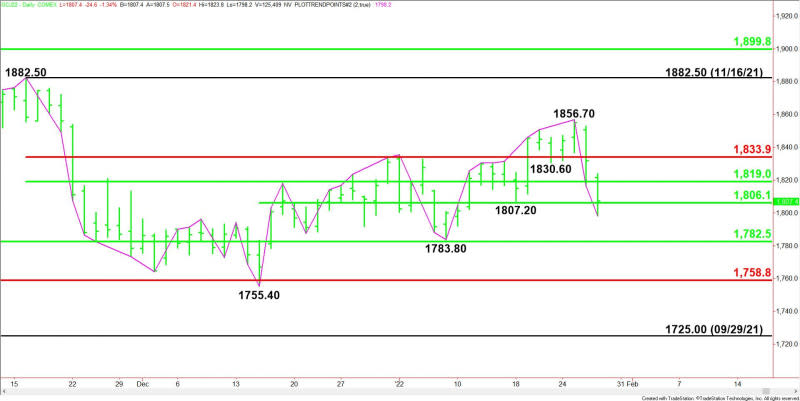
The main trend is up according to the daily swing chart. However, momentum is trending lower. A trade through $1856.70 will signal a resumption of the downtrend. A move through $1783.80 will change the main trend to down.
The minor trend is down. It changed to down on Wednesday when sellers took out $1830.60. The move shifted momentum to the downside.
The short-term range is $1882.50 to $1755.40. Its retracement zone at $1819.00 to $1833.90 is potential support.
The main retracement zone support is $1782.50 to $1758.80. This area is controlling the near-term direction of the market.
Gold is currently straddling a minor pivot at $1806.10.
Daily Swing Chart Technical Forecast
The direction of the April Comex gold market into the close will be determined by trader reaction to $1806.10.
Bearish Scenario
A sustained move under $1806.10 will indicate the presence of sellers. If this move continues to create enough downside momentum then look for a break into the support cluster at $1782.50 to $1783.80.
Taking out $1783.80 will change the main trend to down and could trigger an acceleration into $1758.80.
Bullish Scenario
A sustained move over $1806.10 will signal the presence of buyers. If this move generates enough upside momentum then look for the rally to possibly extend into $1819.00 to $1833.90.
Aggressive counter-trend sellers could show up on a test of this area. They will be trying to form a potentially bearish secondary lower top. This will be the first indication of lower prices to follow.
For a look at all of today’s economic events, check out our economic calendar.
This article was originally posted on FX Empire

