Is APT Satellite Holdings Limited's (HKG:1045) P/E Ratio Really That Good?

This article is for investors who would like to improve their understanding of price to earnings ratios (P/E ratios). We'll look at APT Satellite Holdings Limited's (HKG:1045) P/E ratio and reflect on what it tells us about the company's share price. Looking at earnings over the last twelve months, APT Satellite Holdings has a P/E ratio of 5.72. That is equivalent to an earnings yield of about 17.5%.
See our latest analysis for APT Satellite Holdings
How Do You Calculate A P/E Ratio?
The formula for P/E is:
Price to Earnings Ratio = Share Price ÷ Earnings per Share (EPS)
Or for APT Satellite Holdings:
P/E of 5.72 = HK$2.84 ÷ HK$0.50 (Based on the trailing twelve months to June 2019.)
Is A High Price-to-Earnings Ratio Good?
A higher P/E ratio means that investors are paying a higher price for each HK$1 of company earnings. That isn't necessarily good or bad, but a high P/E implies relatively high expectations of what a company can achieve in the future.
How Does APT Satellite Holdings's P/E Ratio Compare To Its Peers?
One good way to get a quick read on what market participants expect of a company is to look at its P/E ratio. If you look at the image below, you can see APT Satellite Holdings has a lower P/E than the average (17.6) in the telecom industry classification.
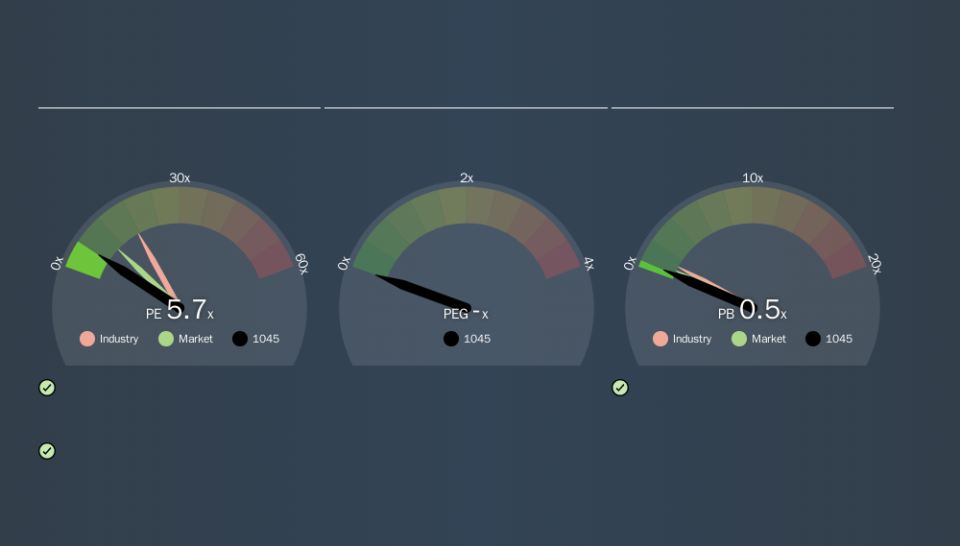
Its relatively low P/E ratio indicates that APT Satellite Holdings shareholders think it will struggle to do as well as other companies in its industry classification. Since the market seems unimpressed with APT Satellite Holdings, it's quite possible it could surprise on the upside. It is arguably worth checking if insiders are buying shares, because that might imply they believe the stock is undervalued.
How Growth Rates Impact P/E Ratios
When earnings fall, the 'E' decreases, over time. Therefore, even if you pay a low multiple of earnings now, that multiple will become higher in the future. So while a stock may look cheap based on past earnings, it could be expensive based on future earnings.
APT Satellite Holdings shrunk earnings per share by 15% over the last year. And over the longer term (5 years) earnings per share have decreased 2.5% annually. This could justify a pessimistic P/E.
A Limitation: P/E Ratios Ignore Debt and Cash In The Bank
The 'Price' in P/E reflects the market capitalization of the company. In other words, it does not consider any debt or cash that the company may have on the balance sheet. In theory, a company can lower its future P/E ratio by using cash or debt to invest in growth.
Such expenditure might be good or bad, in the long term, but the point here is that the balance sheet is not reflected by this ratio.
How Does APT Satellite Holdings's Debt Impact Its P/E Ratio?
APT Satellite Holdings has net cash of HK$666m. This is fairly high at 25% of its market capitalization. That might mean balance sheet strength is important to the business, but should also help push the P/E a bit higher than it would otherwise be.
The Bottom Line On APT Satellite Holdings's P/E Ratio
APT Satellite Holdings trades on a P/E ratio of 5.7, which is below the HK market average of 10.2. The recent drop in earnings per share would almost certainly temper expectations, but the net cash position means the company has time to improve: if so, the low P/E could be an opportunity.
When the market is wrong about a stock, it gives savvy investors an opportunity. If the reality for a company is not as bad as the P/E ratio indicates, then the share price should increase as the market realizes this. Although we don't have analyst forecasts you might want to assess this data-rich visualization of earnings, revenue and cash flow.
You might be able to find a better buy than APT Satellite Holdings. If you want a selection of possible winners, check out this free list of interesting companies that trade on a P/E below 20 (but have proven they can grow earnings).
We aim to bring you long-term focused research analysis driven by fundamental data. Note that our analysis may not factor in the latest price-sensitive company announcements or qualitative material.
If you spot an error that warrants correction, please contact the editor at editorial-team@simplywallst.com. This article by Simply Wall St is general in nature. It does not constitute a recommendation to buy or sell any stock, and does not take account of your objectives, or your financial situation. Simply Wall St has no position in the stocks mentioned. Thank you for reading.
