As the utility sector continues to shine, one company is waving a bullish flag. (CNP: NYSE)
This analysis was brought to you by Yahoo Finance Premium. Click here to start your free trial* and step up your investing.
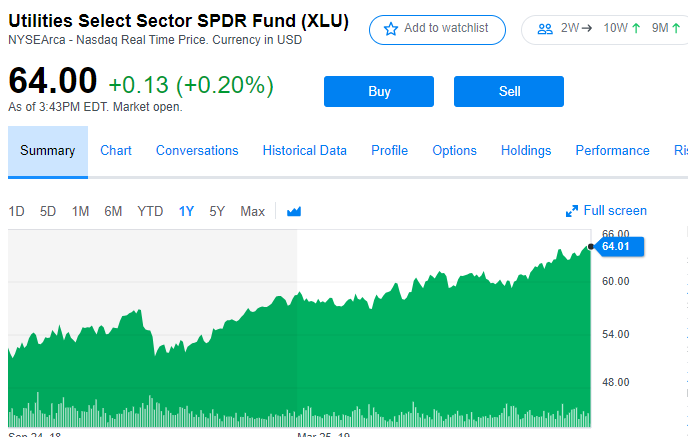
The Utilities sector remains one of the best sectors in the S&P 500. Looking at the SPDR Utilities Sector fund ETF (XLU), prices remain in an uptrend after climbing 2.36% in the last week making it the best weekly performer. Prices have made an impressive move climbing up over 24% in the last year.
We searched inside the S&P 500 index for short-term bullish classical events happening in the U.S. Utilities sector. One utility stock with a classic pattern breakout caught our attention.
CenterPoint Energy (CNP: NYSE) confirmed a bullish flag pattern. CenterPoint Energy owns a portfolio of energy-related businesses. Its regulated electric utility provides transmission and distribution services to more than 2.5 million customers in the Houston area, southern Indiana, and west central Ohio. The company has natural gas distribution systems in seven states serving approximately 4.5 million customers.
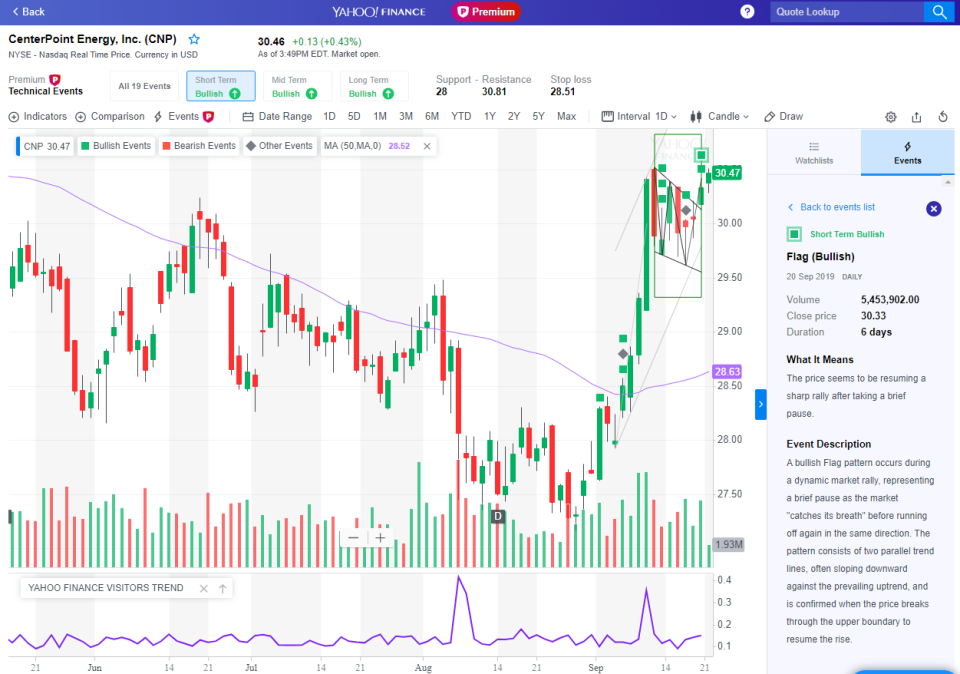
A bullish flag pattern occurs during a dynamic market rally, representing a brief pause as the market "catches its breath" before running off again in the same direction. The pattern consists of two parallel trend lines, often sloping downward against the prevailing uptrend, and is confirmed when the price breaks through the upper boundary to resume the rise.
Classic chart patterns are most interesting to me due to the measured move target they provide. CenterPoint Energy has a target in the range of $32.5 - $33.00 due the flag pattern breakout measured move.
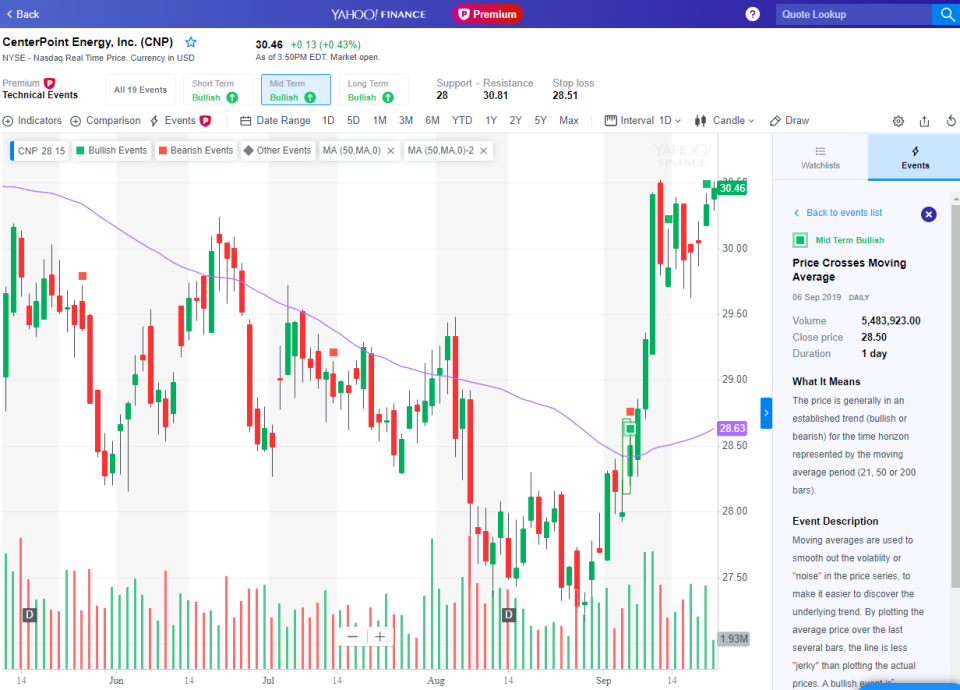
Prices have also broken above their 200-day moving average around the $29.50 level, an average closely followed by technicians as they make ideal stop-loss levels in uptrends.
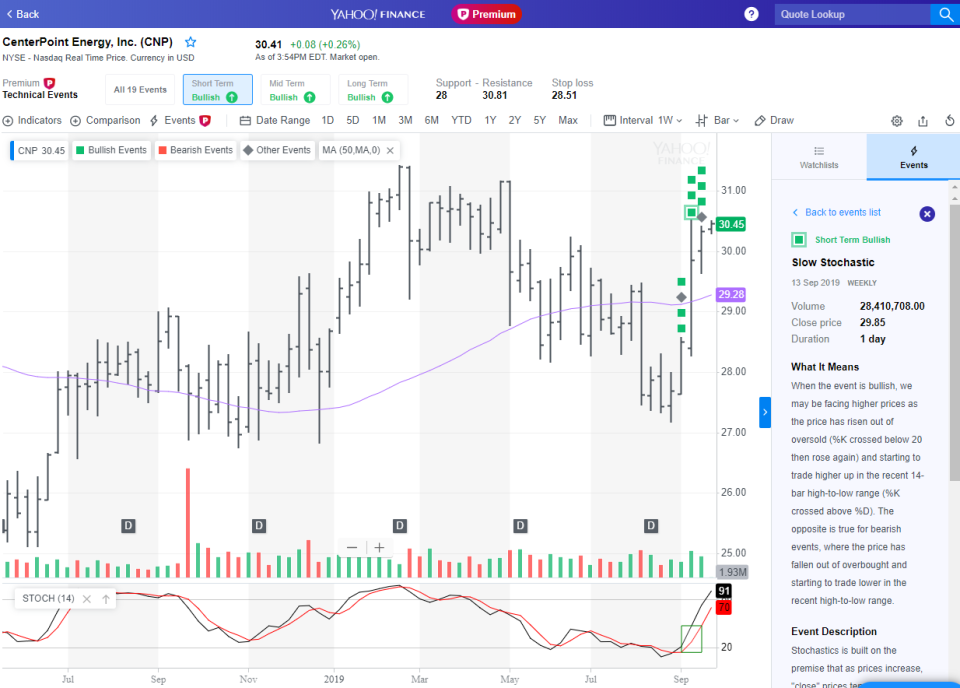
Finally, the Slow Stochastic indicator remains imbedded above its 80 level. Although this can be seen as overbought to some technicians, I like to see this indicator remain in overbought territory when prices are trending higher as it shows strong upside momentum. Stochastics is built on the premise that, as prices increase, "close" prices tend to be closer to the upper end of the recent price range, and vice versa.