Avoid Under Armour Stock Next Month
When we last checked in with Under Armour (NYSE:UAA), the stock was reaping the benefits of a bull note. While the athleisure name has done well on the charts since then, it's running head-first into a trendline with bearish implications, if past is present.
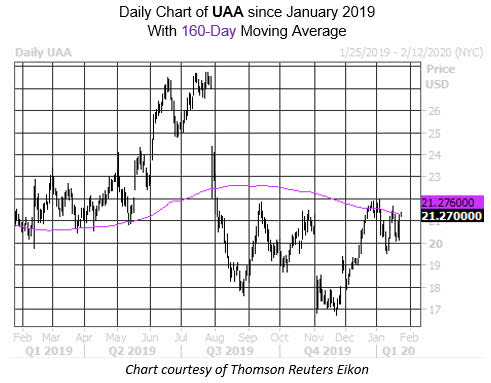
More specifically, Under Armour stock is trading within one standard deviation of its overhead 160-day moving average. According to data from Schaeffer's Senior Quantitative Analyst Rocky White, four similar run-ups to this trendline have occurred in the last three years. One month after these signals, UAA was lower by an average of 9.6%, with three out of the four returns negative. At last check, UAA was up 0.7% to trade at $21.27, so a drop of similar magnitude would put the stock back below its 12-month breakeven point by the end of February.
Such a pullback would have short sellers cheering. Although short interest only increased by 2% in the most recent reporting period, the 35.90 million shares sold short accounts for 19.2% of UAA's total available float, and 7.3 times the average daily trading volume.
Among options traders, puts are all the rage. At the International Securities Exchange (ISE), Cboe Options Exchange (CBOE), and NASDAQ OMX PHLX (PHLX), UAA's 10-day put/call volume ratio is perched at 2.22 and ranks in the 95th percentile of its annual range. Digging deeper, the July 15 put is home to the largest increase in open interest during this time frame, followed closely by the February 20 put.
Echoing this, the security sports a Schaeffer's put/call open interest ratio (SOIR) of 2.05. This ratio is 1 percentage point from an annual high, meaning short-term traders have rarely been more put-biased during the past 12 months.
