Azure Healthcare Limited’s (ASX:AZV) Investment Returns Are Lagging Its Industry

Today we'll evaluate Azure Healthcare Limited (ASX:AZV) to determine whether it could have potential as an investment idea. To be precise, we'll consider its Return On Capital Employed (ROCE), as that will inform our view of the quality of the business.
First, we'll go over how we calculate ROCE. Next, we'll compare it to others in its industry. Last but not least, we'll look at what impact its current liabilities have on its ROCE.
What is Return On Capital Employed (ROCE)?
ROCE measures the amount of pre-tax profits a company can generate from the capital employed in its business. In general, businesses with a higher ROCE are usually better quality. Overall, it is a valuable metric that has its flaws. Renowned investment researcher Michael Mauboussin has suggested that a high ROCE can indicate that 'one dollar invested in the company generates value of more than one dollar'.
So, How Do We Calculate ROCE?
Analysts use this formula to calculate return on capital employed:
Return on Capital Employed = Earnings Before Interest and Tax (EBIT) ÷ (Total Assets - Current Liabilities)
Or for Azure Healthcare:
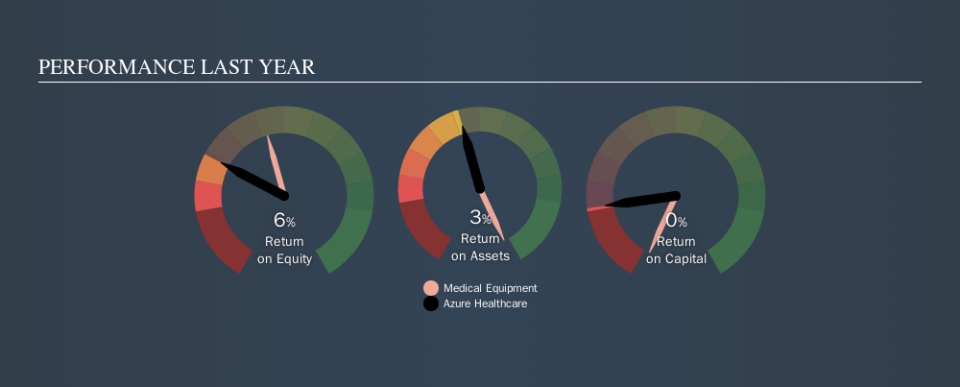
0.0026 = AU$27k ÷ (AU$20m - AU$9.2m) (Based on the trailing twelve months to June 2019.)
So, Azure Healthcare has an ROCE of 0.3%.
See our latest analysis for Azure Healthcare
Does Azure Healthcare Have A Good ROCE?
When making comparisons between similar businesses, investors may find ROCE useful. Using our data, Azure Healthcare's ROCE appears to be significantly below the 15% average in the Medical Equipment industry. This could be seen as a negative, as it suggests some competitors may be employing their capital more efficiently. Independently of how Azure Healthcare compares to its industry, its ROCE in absolute terms is low; especially compared to the ~2.3% available in government bonds. It is likely that there are more attractive prospects out there.
Azure Healthcare reported an ROCE of 0.3% -- better than 3 years ago, when the company didn't make a profit. That implies the business has been improving. You can click on the image below to see (in greater detail) how Azure Healthcare's past growth compares to other companies.
It is important to remember that ROCE shows past performance, and is not necessarily predictive. Companies in cyclical industries can be difficult to understand using ROCE, as returns typically look high during boom times, and low during busts. This is because ROCE only looks at one year, instead of considering returns across a whole cycle. If Azure Healthcare is cyclical, it could make sense to check out this free graph of past earnings, revenue and cash flow.
Azure Healthcare's Current Liabilities And Their Impact On Its ROCE
Current liabilities include invoices, such as supplier payments, short-term debt, or a tax bill, that need to be paid within 12 months. Due to the way the ROCE equation works, having large bills due in the near term can make it look as though a company has less capital employed, and thus a higher ROCE than usual. To check the impact of this, we calculate if a company has high current liabilities relative to its total assets.
Azure Healthcare has total assets of AU$20m and current liabilities of AU$9.2m. Therefore its current liabilities are equivalent to approximately 47% of its total assets. With a medium level of current liabilities boosting the ROCE a little, Azure Healthcare's low ROCE is unappealing.
The Bottom Line On Azure Healthcare's ROCE
There are likely better investments out there. But note: make sure you look for a great company, not just the first idea you come across. So take a peek at this free list of interesting companies with strong recent earnings growth (and a P/E ratio below 20).
For those who like to find winning investments this free list of growing companies with recent insider purchasing, could be just the ticket.
We aim to bring you long-term focused research analysis driven by fundamental data. Note that our analysis may not factor in the latest price-sensitive company announcements or qualitative material.
If you spot an error that warrants correction, please contact the editor at editorial-team@simplywallst.com. This article by Simply Wall St is general in nature. It does not constitute a recommendation to buy or sell any stock, and does not take account of your objectives, or your financial situation. Simply Wall St has no position in the stocks mentioned. Thank you for reading.
