Baseball Is Back! What Playing in Empty Stadiums Will Cost MLB
In the pandemic-shortened 2020 season, Major League Baseball teams played their 60 games in empty stadiums, with only cardboard cutouts in the stands.
With COVID-19 vaccines being rolled out, the chances are improving for allowing fans back inside MLB stadiums. However, to mix sports metaphors, full grandstands are no slam dunk.
Find Out: Maria Sharapova and 45 More Incredibly Rich Retired Athletes
The public health situation in the United States is changing by the day, and although more people are receiving the vaccine every day, questions remain: How quickly will the entire population be inoculated? What effects will coronavirus variants have? Can a person who has received the vaccine still spread the virus to others?
Major League Baseball wants to have fans back in the stands safely, of course. But the league will defer to state and local authorities on guidelines for how many spectators allowed.
With all those uncertainties, the financial hit to the league remains massive. Without fewer fans at the games, the sport of baseball just isn’t going to be the revenue driver it normally is. In fact, teams still stand to lose millions of dollars in lost ticket sales, concessions and merchandise. After all, the profit margin on $8 beers and $5 hot dogs is, well, extreme.
Go Banking Rates took a look at the worst-case scenario, calculating how much each team would lose if no fans are allowed for a full season.
Last updated: Feb. 24, 2021
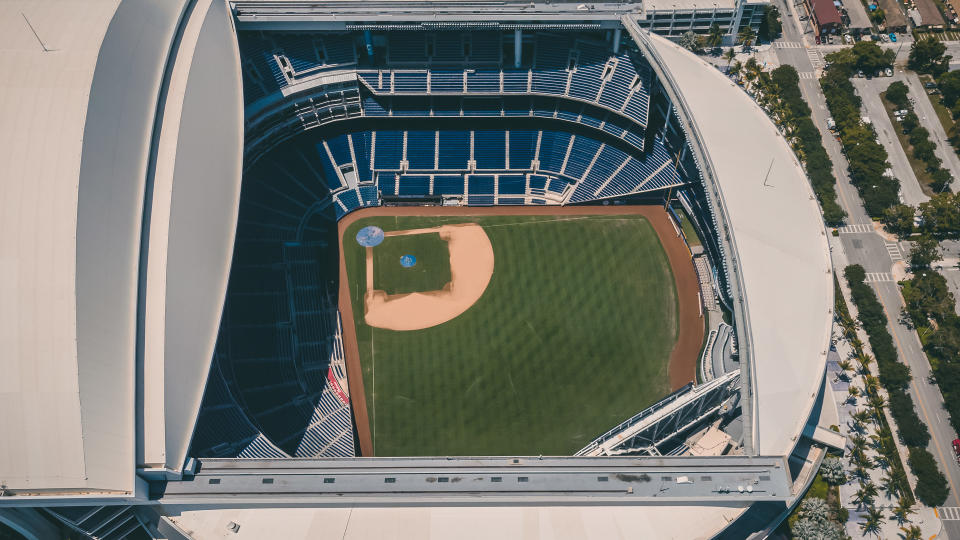
30. Miami Marlins
Average attendance: 10,016
Average ticket price: $24.65
Revenue per home game: $2,740,740.74
Gate receipts per home game: $246,913.58
Yearly gate receipts: $20,000,000
Food and merchandise revenue per home game: $2,493,827.16
Yearly food and merchandise revenue: $202,000,000
Annual revenue: $222,000,000
Check Out: Athletes With Major Business Empires Outside of Sports
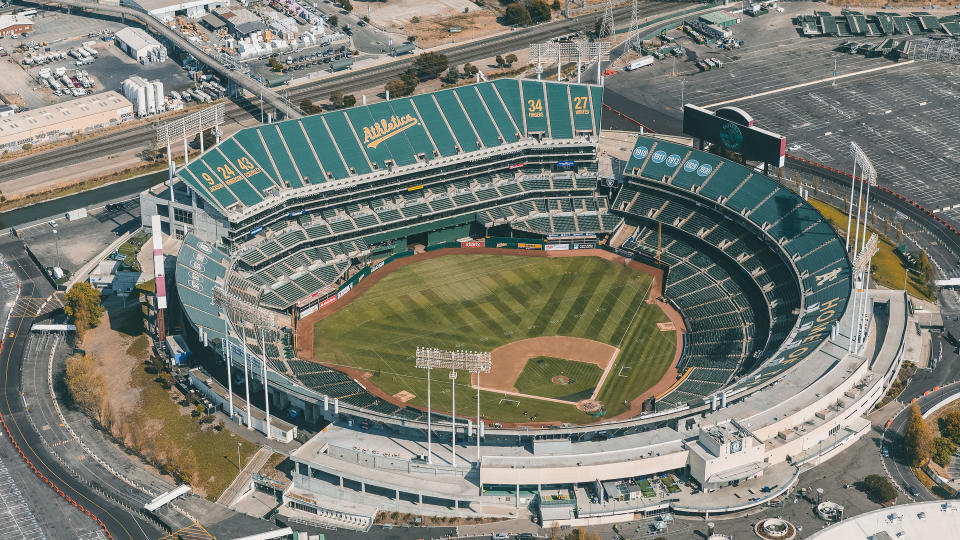
29. Oakland A's
Average attendance: 20,521
Average ticket price: $24.65
Revenue per home game: $2,777,777.78
Gate receipts per home game: $469,135.80
Yearly gate receipts: $38,000,000
Food and merchandise revenue per home game: $2,308,641.98
Yearly food and merchandise revenue: $187,000,000
Annual revenue: $225,000,000
Just Like Us: Former Celebrities Who Have Normal Jobs Now
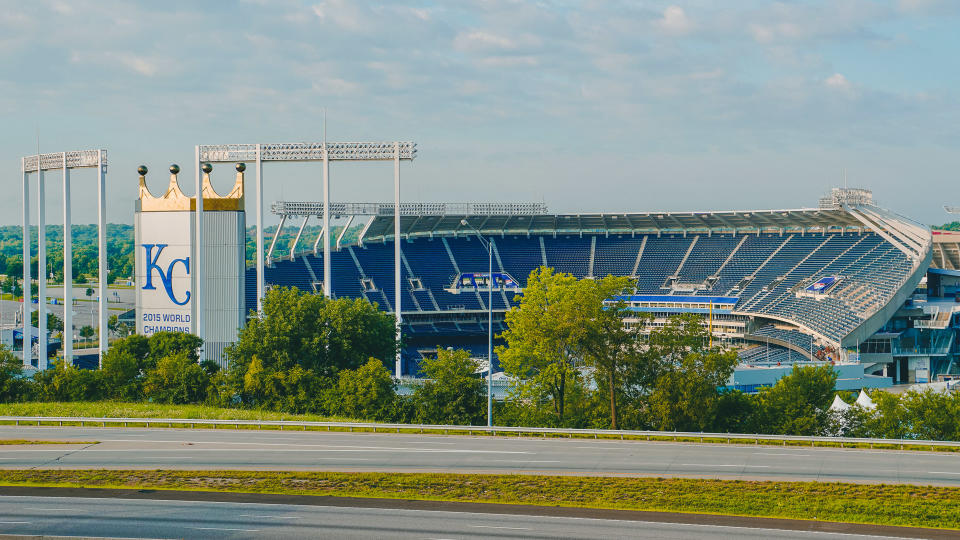
28. Kansas City Royals
Average attendance: 18,267
Average ticket price: $33.12
Revenue per home game: $3,098.765.43
Gate receipts per home game: $604,938.27
Yearly gate receipts: $49,000,000
Food and merchandise revenue per home game: $2,493,827.16
Yearly food and merchandise revenue: $202,000,000
Annual revenue: $251,000,000
Learn More: What NFL Teams Are Making With Limited Fan Capacity
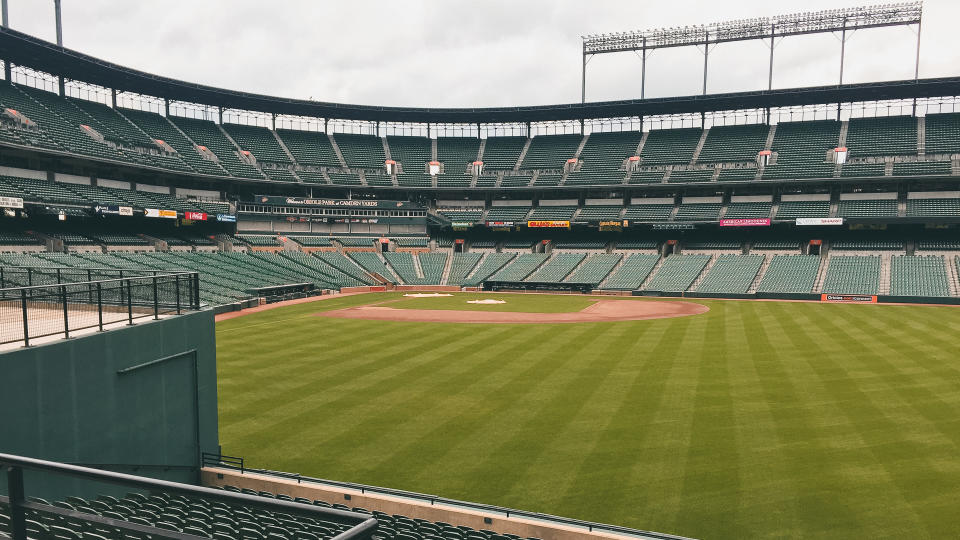
27. Baltimore Orioles
Average attendance: 16,146
Average ticket price: $26.76
Revenue per home game: $3,160,493.83
Gate receipts per home game: $432,098.77
Yearly gate receipts: $35,000,000
Food and merchandise revenue per home game: $2,728,395.06
Yearly food and merchandise revenue: $221,000,000
Annual revenue: $256,000,000
Making Bank: The Richest Athletes in the World
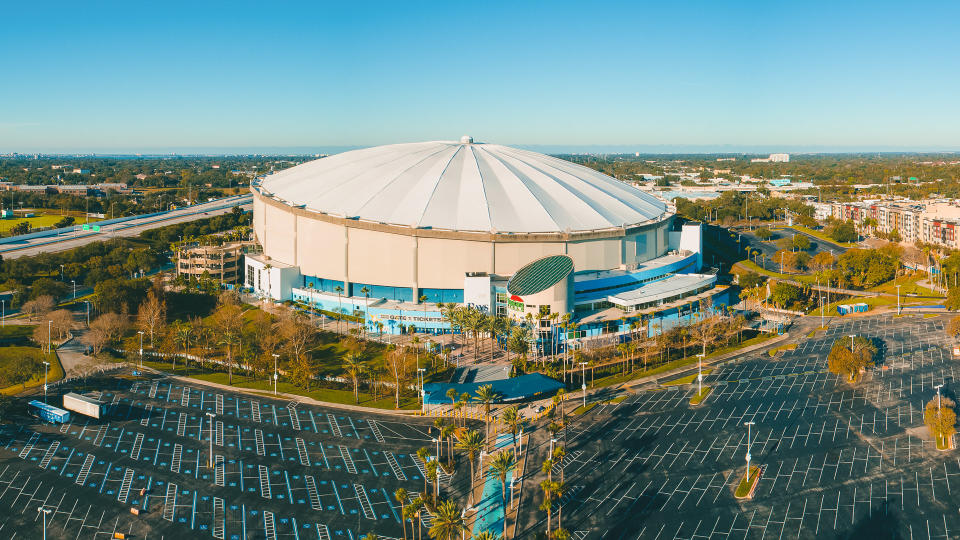
26. Tampa Bay Rays
Average attendance: 14,552
Average ticket price: $26.30
Revenue per home game: $3,259,259.26
Gate receipts per home game: $382,716.05
Yearly gate receipts: $31,000,000
Food and merchandise revenue per home game: $2,876,543.21
Yearly food and merchandise revenue: $233,000,000
Annual revenue: $264,000,000
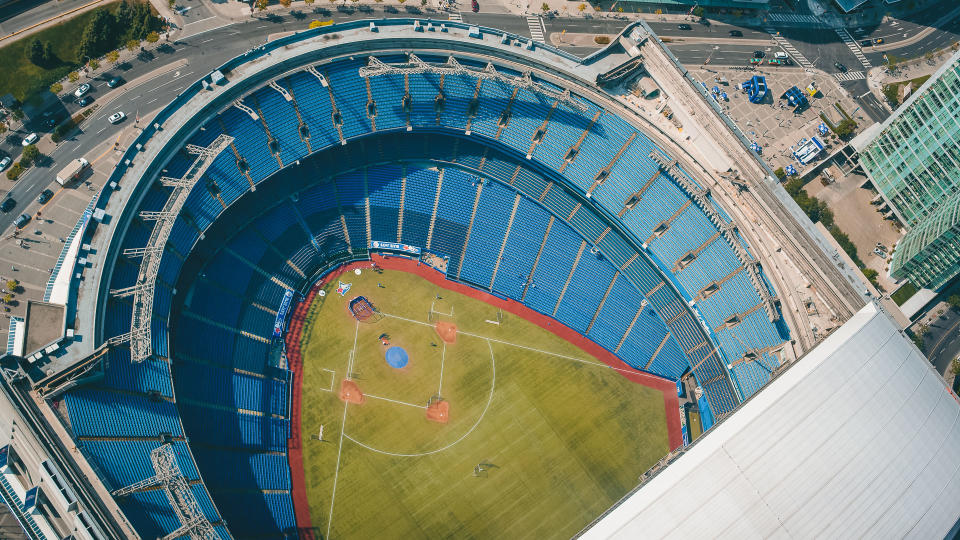
25. Toronto Blue Jays
Average attendance: 21,607
Average ticket price: $28.57
Revenue per home game: $3,271,604.94
Gate receipts per home game: $617,283.95
Yearly gate receipts: $50,000,000
Food and merchandise revenue per home game: $2,654,320.99
Yearly food and merchandise revenue: $215,000,000
Annual revenue: $265,000,000
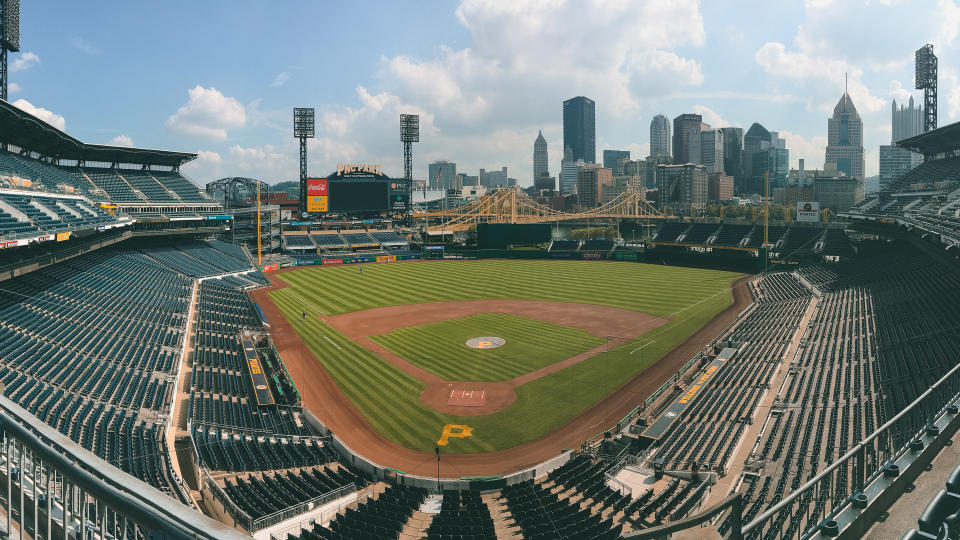
24. Pittsburgh Pirates
Average attendance: 18,413
Average ticket price: $29.50
Revenue per home game: $3,370,370.37
Gate receipts per home game: $543,209.88
Yearly gate receipts: $44,000,000
Food and merchandise revenue per home game: $2,827,160.49
Yearly food and merchandise revenue: $229,000,000
Annual revenue: $273,000,000
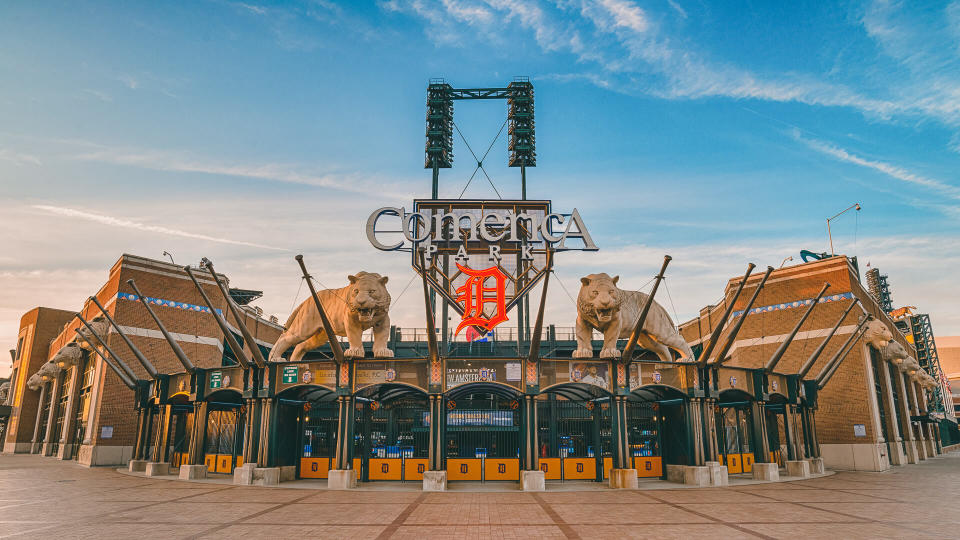
23. Detroit Tigers
Average attendance: 18,536
Average ticket price: $30.64
Revenue per home game: $3,407,407.41
Gate receipts per home game: $567,901.23
Yearly gate receipts: $46,000,000
Food and merchandise revenue per home game: $2,839,506.17
Yearly food and merchandise revenue: $230,000,000
Annual revenue: $276,000,000
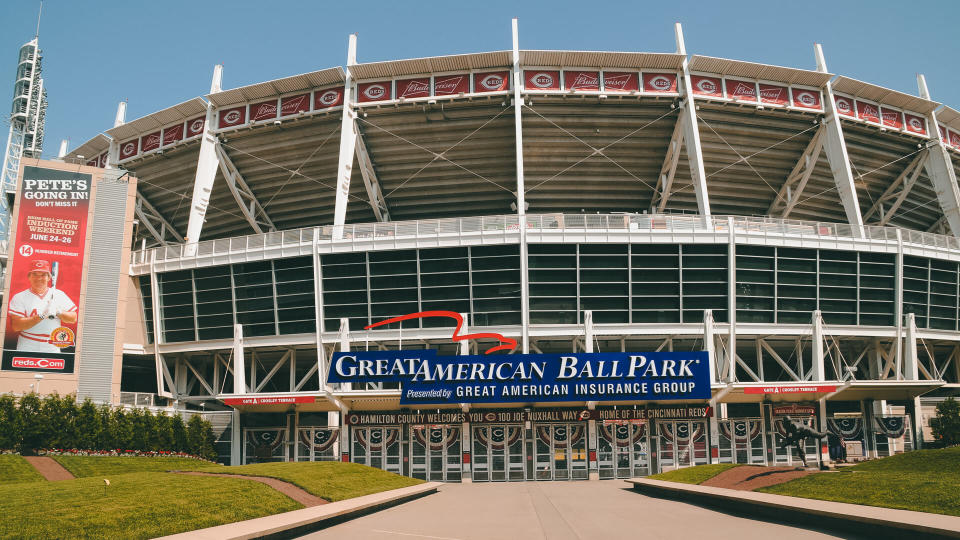
22. Cincinnati Reds
Average attendance: 22,329
Average ticket price: $24.88
Revenue per home game: $3,407,407.41
Gate receipts per home game: $555,555.56
Yearly gate receipts: $45,000,000
Food and merchandise revenue per home game: $2,851,851.85
Yearly food and merchandise revenue: $231,000,000
Annual revenue: $276,000,000

21. Arizona Diamondbacks
Average attendance: 26,364
Average ticket price: $25.29
Revenue per home game: $3,432,098.77
Gate receipts per home game: $666,666.67
Yearly gate receipts: $54,000,000
Food and merchandise revenue per home game: $2,7,65,432.10
Yearly food and merchandise revenue: $224,000,000
Annual revenue: $278,000,000
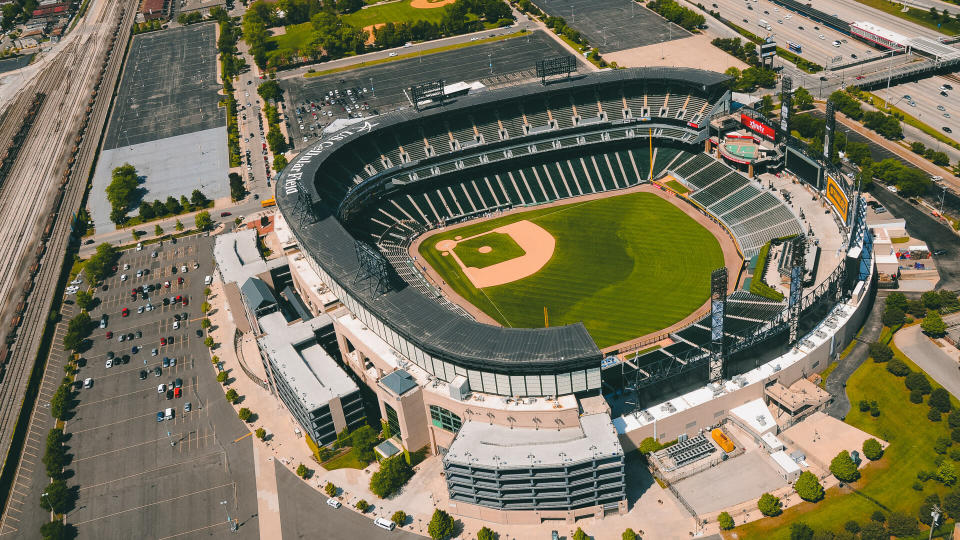
20. Chicago White Sox
Average attendance: 20,622
Average ticket price: $27.54
Revenue per home game: $3,518,518.52
Gate receipts per home game: $567,901.23
Yearly gate receipts: $46,000,000
Food and merchandise revenue per home game: $2,950,617.28
Yearly food and merchandise revenue: $239,000,000
Annual revenue: $285,000,000
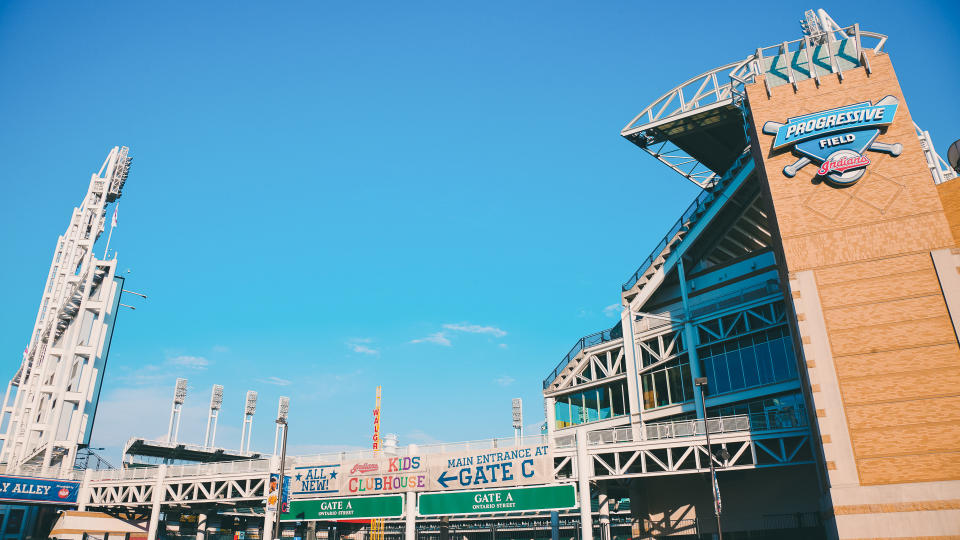
19. Cleveland Indians
Average attendance: 21,465
Average ticket price: $37.96
Revenue per home game: $3,580,246.91
Gate receipts per home game: $814,814,81
Yearly gate receipts: $66,000,000
Food and merchandise revenue per home game: $2,765,432.10
Yearly food and merchandise revenue: $224,000,000
Annual revenue: $290,000,000
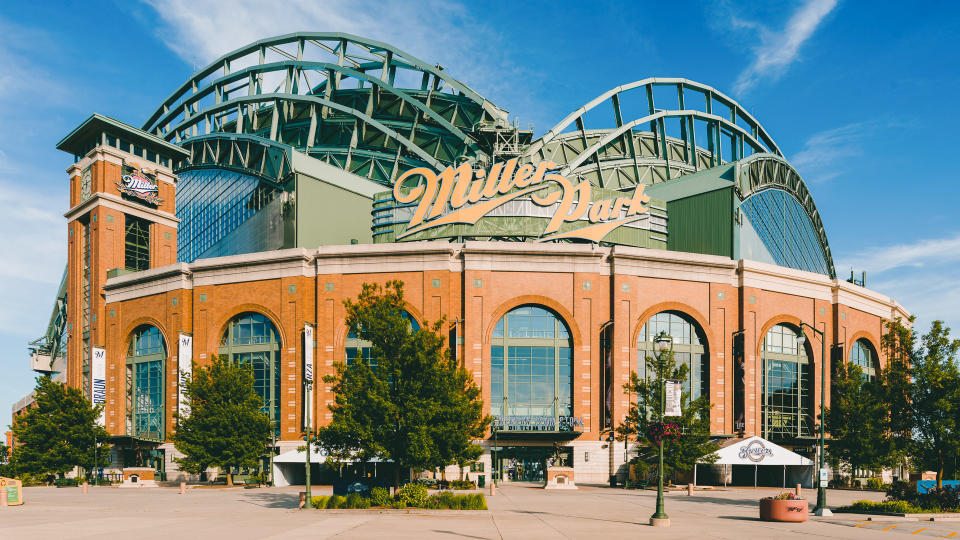
18. Milwaukee Brewers
Average attendance: 36,091
Average ticket price: $27.71
Revenue per home game: $3,641,975.31
Gate receipts per home game: $1,000,000
Yearly gate receipts: $81,000,000
Food and merchandise revenue per home game: $2,641,975.31
Yearly food and merchandise revenue: $214,000,000
Annual revenue: $295,000,000
Look: 13 Ways To Support Sports Teams Without Attending a Game
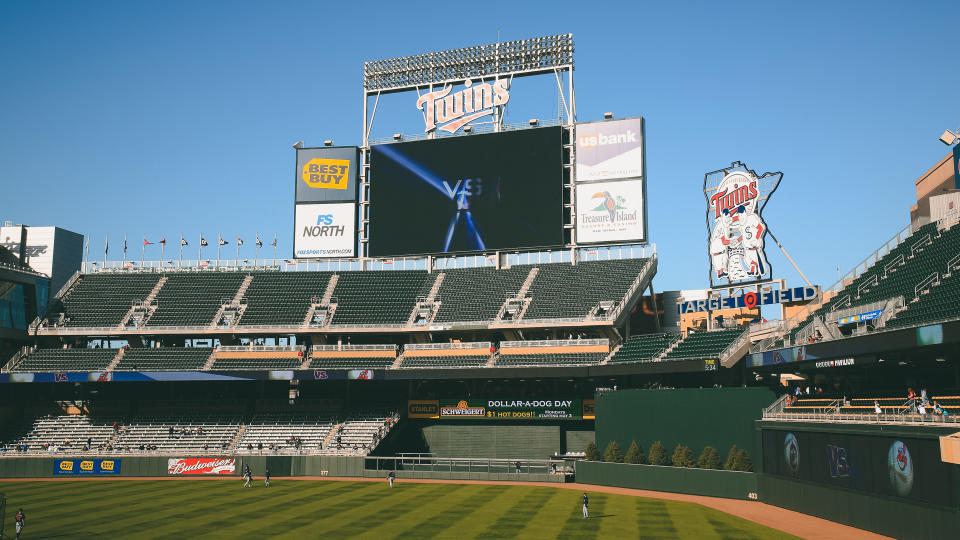
17. Minnesota Twins
Average attendance: 28,323
Average ticket price: $34.44
Revenue per home game: $3,666,666,67
Gate receipts per home game: $975,308.64
Yearly gate receipts: $79,000,000
Food and merchandise revenue per home game: $2,691,975.31
Yearly food and merchandise revenue: $218,000,000
Annual revenue: $297,000,000
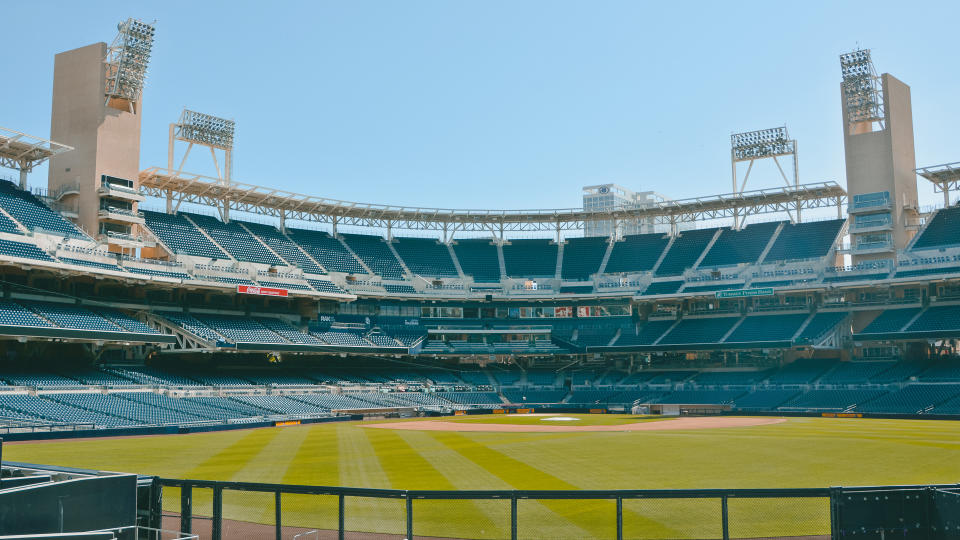
16. San Diego Padres
Average attendance: 29,585
Average ticket price: $26.29
Revenue per home game: $3,691,358.02
Gate receipts per home game: $777,777.78
Yearly gate receipts: $63,000,000
Food and merchandise revenue per home game: $2,913,580.25
Yearly food and merchandise revenue: $236,000,000
Annual revenue: $299,000,000
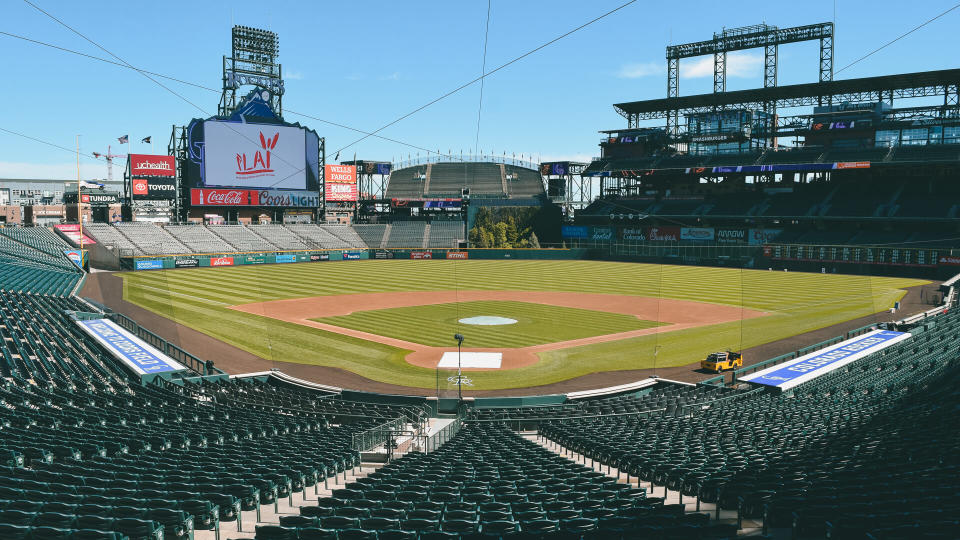
15. Colorado Rockies
Average attendance: 36,954
Average ticket price: $26.73
Revenue per home game: $3,765,432.10
Gate receipts per home game: $987,654.32
Yearly gate receipts: $80,000,000
Food and merchandise revenue per home game: $2,777,777.78
Yearly food and merchandise revenue: $225,000,000
Annual revenue: $305,000,000
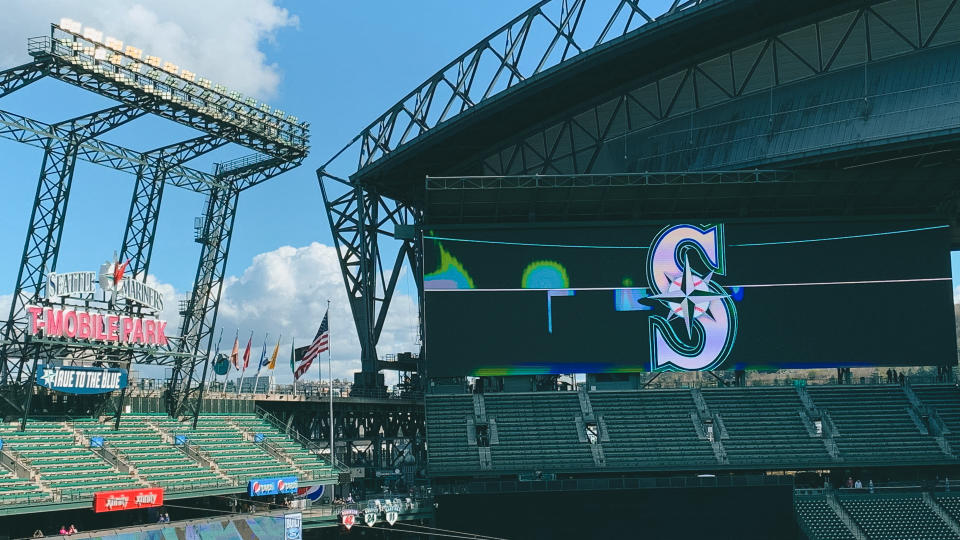
14. Seattle Mariners
Average attendance: 22,120
Average ticket price: $32.37
Revenue per home game: $3,888,888.89
Gate receipts per home game: $716,049.38
Yearly gate receipts: $58,000,000
Food and merchandise revenue per home game: $3,172,839.51
Yearly food and merchandise revenue: $257,000,000
Annual revenue: $315,000,000
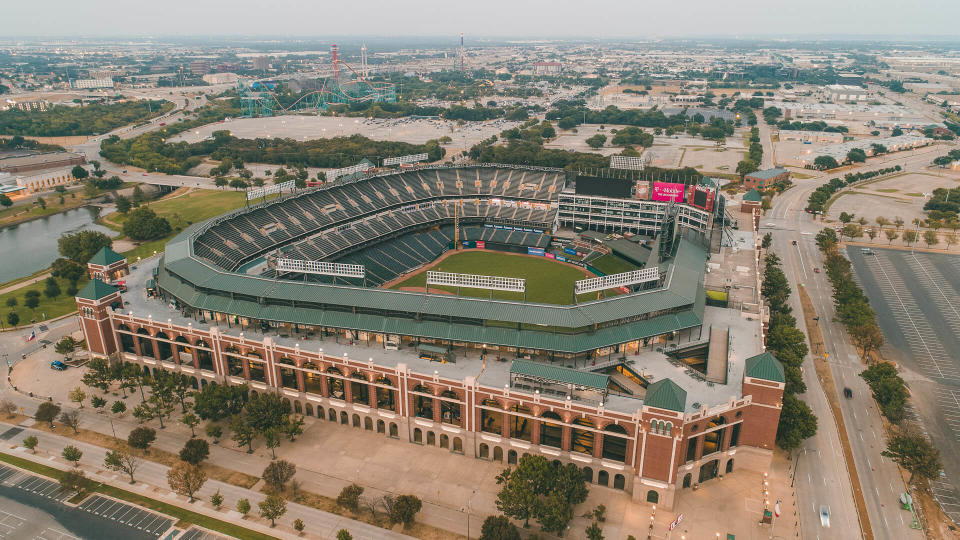
13. Texas Rangers
Average attendance: 26,333
Average ticket price: $33.29
Revenue per home game: $4,135,802.47
Gate receipts per home game: $876,543.21
Yearly gate receipts: $71,000,000
Food and merchandise revenue per home game: $3,259,259.26
Yearly food and merchandise revenue: $265,000,000
Annual revenue: $335,000,000
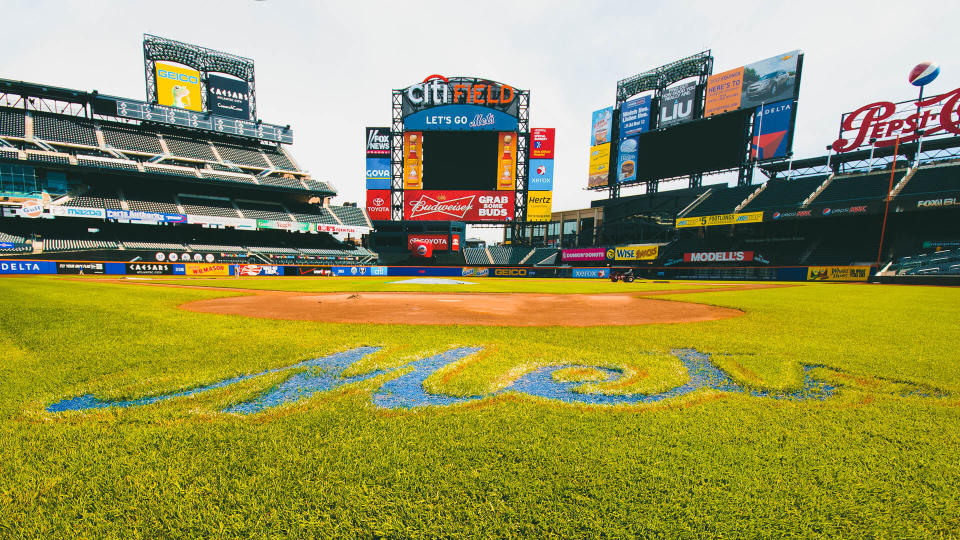
12. New York Mets
Average attendance: 30,155
Average ticket price: $41.35
Revenue per home game: $4,469,135.80
Gate receipts per home game: $1,246,913.58
Yearly gate receipts: $101,000,000
Food and merchandise revenue per home game: $3,222,222.22
Yearly food and merchandise revenue: $261,000,000
Annual revenue: $362,000,000
Alternative Competition: Overwatch, Fortnite and 22 of the Most Lucrative Esports Games in the World
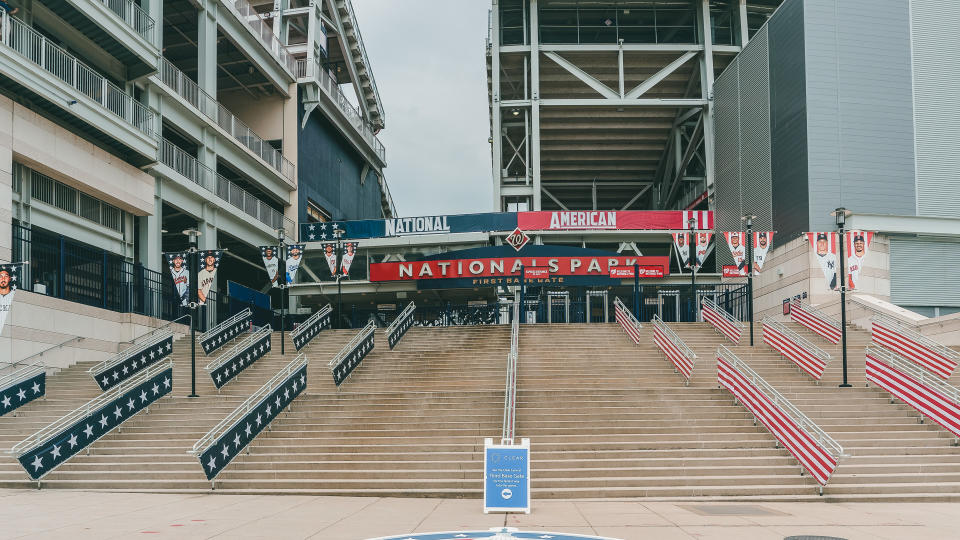
11. Washington Nationals
Average attendance: 27,899
Average ticket price: $61.95
Revenue per home game: $4,567,901.23
Gate receipts per home game: $1,728,395.07
Yearly gate receipts: $140,000,000
Food and merchandise revenue per home game: $2,839,506.17
Yearly food and merchandise revenue: $230,000,000
Annual revenue: $370,000,000

10. Los Angeles Angels
Average attendance: 37,272
Average ticket price: $35.11
Revenue per home game: $4,654,320.99
Gate receipts per home game: $1,308,641.98
Yearly gate receipts: $106,000,000
Food and merchandise revenue per home game: $3,345,679.01
Yearly food and merchandise revenue: $271,000,000
Annual revenue: $377,000,000
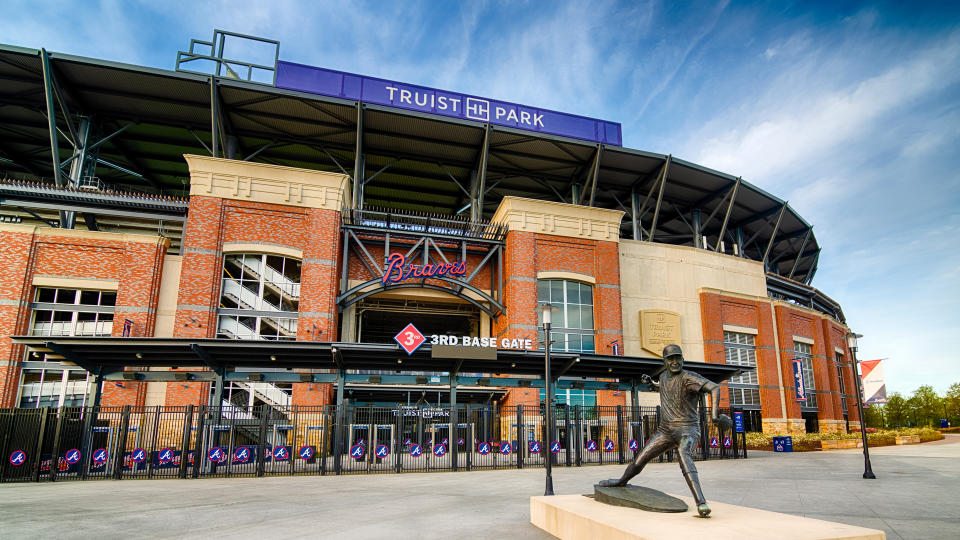
9. Atlanta Braves
Average attendance: 32,779
Average ticket price: $40.68
Revenue per home game: $4,716,049.38
Gate receipts per home game: $1,333,333.33
Yearly gate receipts: $108,000,000
Food and merchandise revenue per home game: $3,382,716.05
Yearly food and merchandise revenue: $274,000,000
Annual revenue: $382,000,000
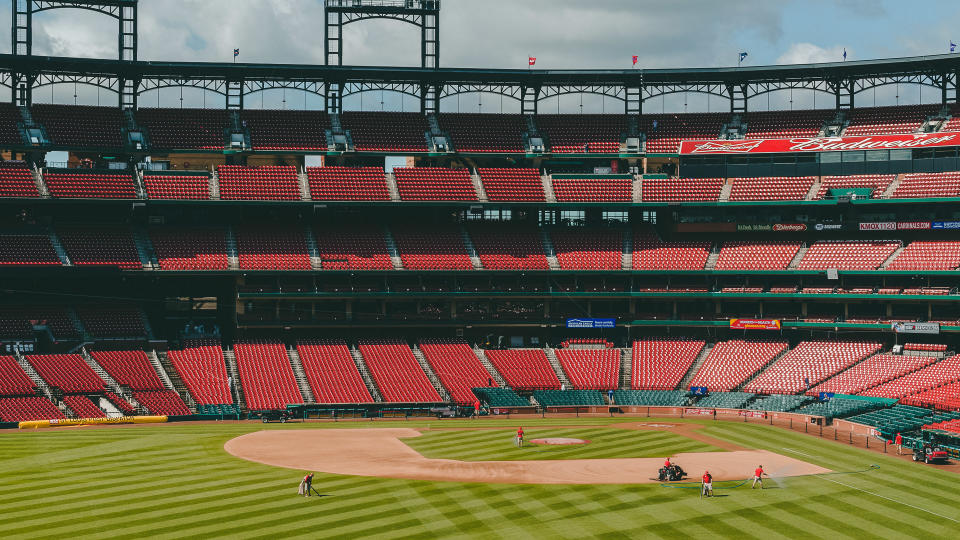
8. St. Louis Cardinals
Average attendance: 42,968
Average ticket price: $39.65
Revenue per home game: $4,728,395.06
Gate receipts per home game: $1,703,703.70
Yearly gate receipts: $138,000,000
Food and merchandise revenue per home game: $3,024,691.36
Yearly food and merchandise revenue: $245,000,000
Annual revenue: $383,000,000
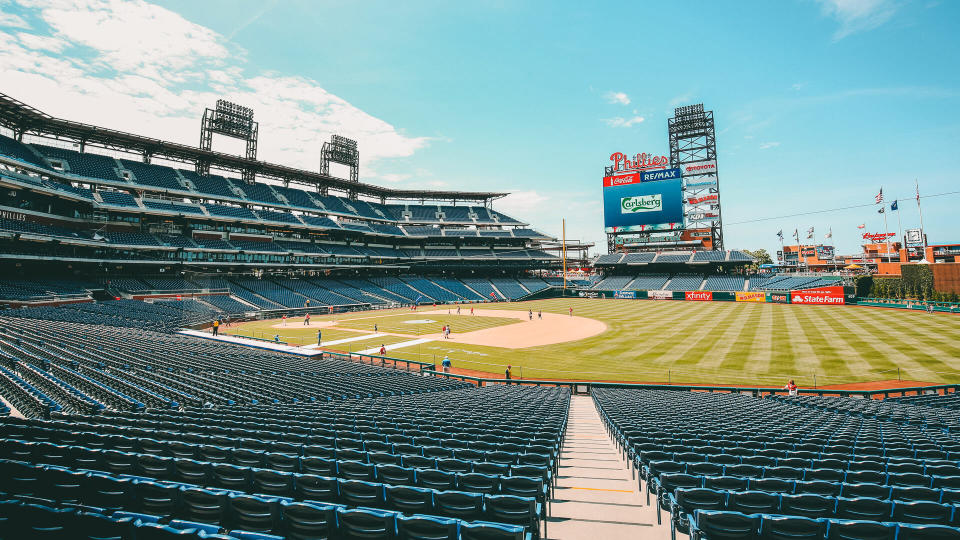
7. Philadelphia Phillies
Average attendance: 33,672
Average ticket price: $39.60
Revenue per home game: $4,839,506.17
Gate receipts per home game: $1,333,333.33
Yearly gate receipts: $108,000,000
Food and merchandise revenue per home game: $3,506,172.84
Yearly food and merchandise revenue: $284,000,000
Annual revenue: $392,000,000
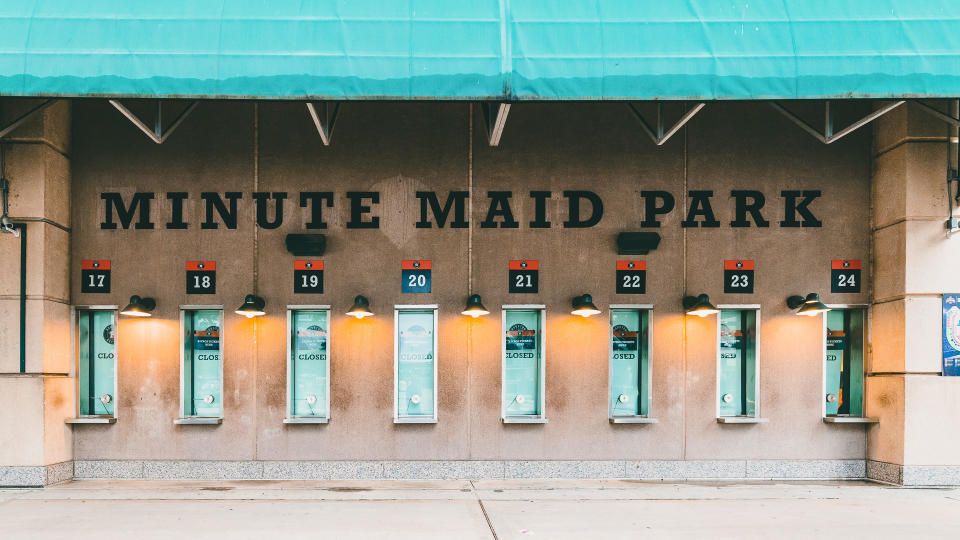
6. Houston Astros
Average attendance: 35,276
Average ticket price: $63.00
Revenue per home game: $5,185,185.19
Gate receipts per home game: $2,222,222.22
Yearly gate receipts: $180,000,000
Food and merchandise revenue per home game: $2,962,962.96
Yearly food and merchandise revenue: $240,000,000
Annual revenue: $420,000,000
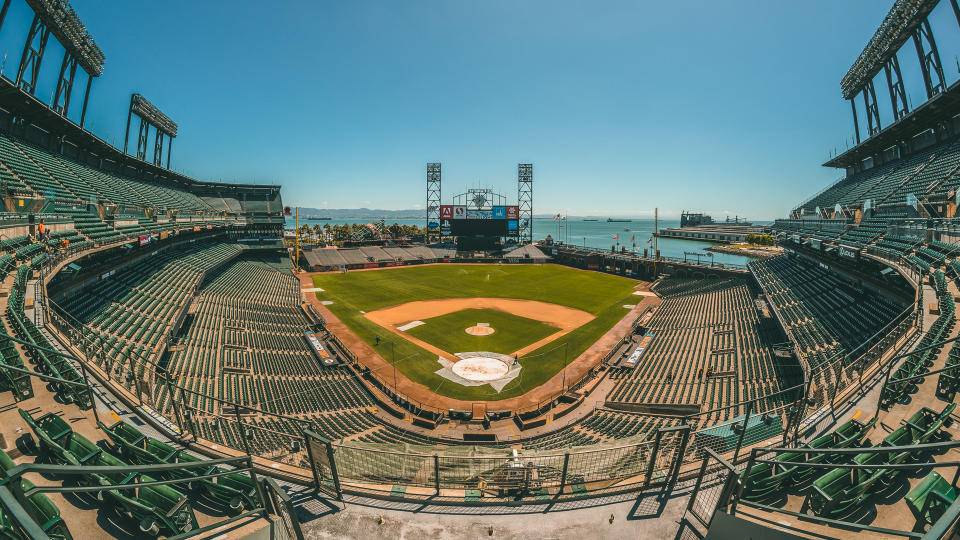
5. San Francisco Giants
Average attendance: 33,429
Average ticket price: $56.87
Revenue per home game: $5,580,246.91
Gate receipts per home game: $1,901,234.57
Yearly gate receipts: $154,000,000
Food and merchandise revenue per home game: $3,679,012.35
Yearly food and merchandise revenue: $298,000,000
Annual revenue: $452,000,000
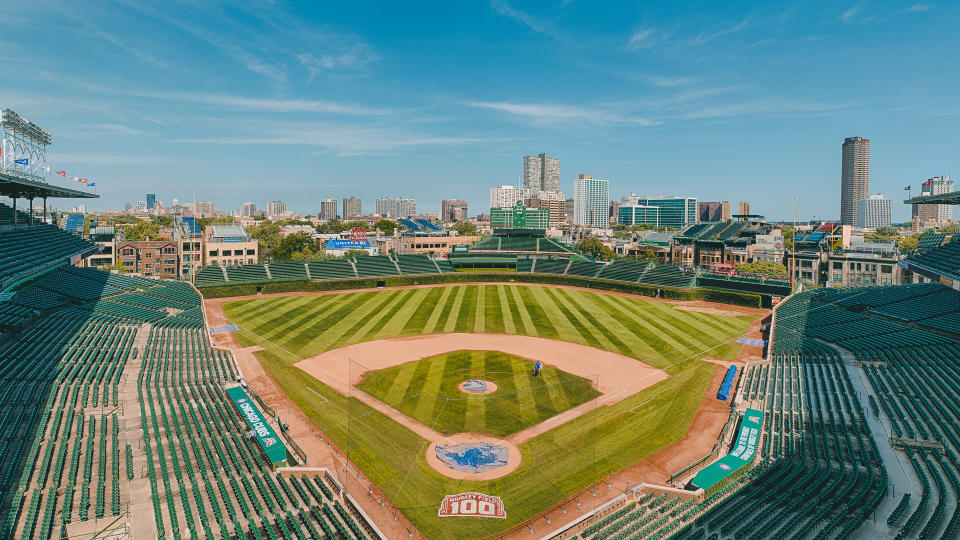
4. Chicago Cubs
Average attendance: 38,208
Average ticket price: $64.62
Revenue per home game: $5,814,814.81
Gate receipts per home game: $2,469,135.80
Yearly gate receipts: $271,000,000
Food and merchandise revenue per home game: $3,345,679.01
Yearly food and merchandise revenue: $271,000,000
Annual revenue: $471,000,000
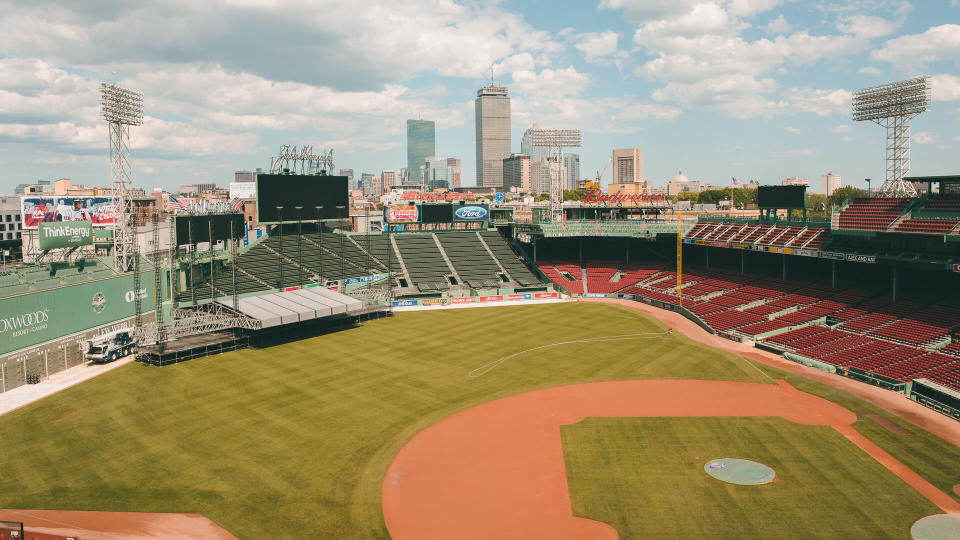
3. Boston Red Sox
Average attendance: 36,107
Average ticket price: $68.04
Revenue per home game: $6,407,407.41
Gate receipts per home game: $2,456,790.12
Yearly gate receipts: $199,000,000
Food and merchandise revenue per home game: $3,950,617.28
Yearly food and merchandise revenue: $320,000,000
Annual revenue: $519,000,000
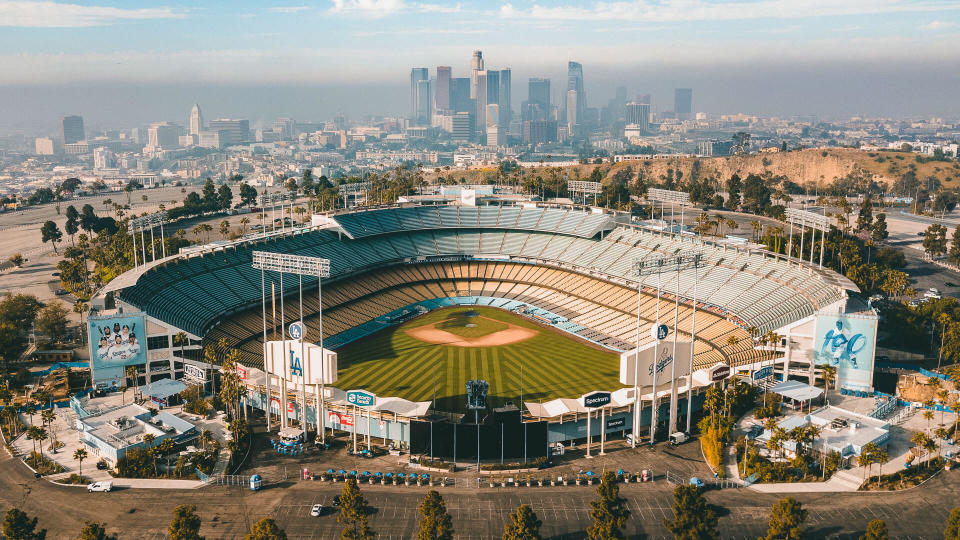
2. Los Angeles Dodgers
Average attendance: 49,066
Average ticket price: $46.55
Revenue per home game: $6,864,197.53
Gate receipts per home game: $2,283,950.62
Yearly gate receipts: $556,000,000
Food and merchandise revenue per home game: $4,580,246.91
Yearly food and merchandise revenue: $371,000,000
Annual revenue: $556,000,000

1. New York Yankees
Average attendance: 40,795
Average ticket price: $86.85
Revenue per home game: $8,432,098.77
Gate receipts per home game: $3,543,209.88
Yearly gate receipts: $287,000,000
Food and merchandise revenue per home game: $4,888,888.89
Yearly food and merchandise revenue: $396,000,000
Annual revenue: $683,000,000
More From GOBankingRates
Methodology:In order to find what a season played in empty stadiums would cost each franchise, GOBankingRates looked at Forbes’ team evaluations for Major League Baseball (MLB). Using these reports and attendance reports for the most recent completed season with full attendance from Baseball Reference (2019), GOBankingRates found the following data points to measure the revenue each franchise will lose out on in one season without fan attendance; (1) yearly revenue, (2) revenue per home game, (3) yearly gate reciepts, (4) gate recipets per home game, (5) average attendance, (6) average ticket price per home game, (7) yearly food and merchandise revenue, (8) food and merchandise revenue per home game. All data was collected on and is up to date as of February 8, 2021.
This article originally appeared on GOBankingRates.com: Baseball Is Back! What Playing in Empty Stadiums Will Cost MLB

