Is BayWa Aktiengesellschaft's (ETR:BYW) 4.5% ROE Worse Than Average?

Many investors are still learning about the various metrics that can be useful when analysing a stock. This article is for those who would like to learn about Return On Equity (ROE). We'll use ROE to examine BayWa Aktiengesellschaft (ETR:BYW), by way of a worked example.
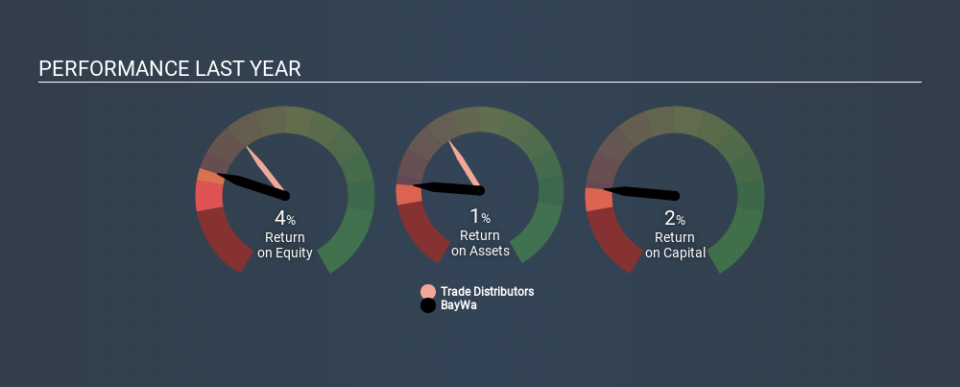
Our data shows BayWa has a return on equity of 4.5% for the last year. That means that for every €1 worth of shareholders' equity, it generated €0.04 in profit.
View our latest analysis for BayWa
How Do You Calculate Return On Equity?
The formula for return on equity is:
Return on Equity = Net Profit (from continuing operations) ÷ Shareholders' Equity
Or for BayWa:
4.5% = €61m ÷ €1.4b (Based on the trailing twelve months to December 2019.)
It's easy to understand the 'net profit' part of that equation, but 'shareholders' equity' requires further explanation. It is all earnings retained by the company, plus any capital paid in by shareholders. You can calculate shareholders' equity by subtracting the company's total liabilities from its total assets.
What Does Return On Equity Signify?
Return on Equity measures a company's profitability against the profit it has kept for the business (plus any capital injections). The 'return' is the amount earned after tax over the last twelve months. A higher profit will lead to a higher ROE. So, all else equal, investors should like a high ROE. That means it can be interesting to compare the ROE of different companies.
Does BayWa Have A Good ROE?
Arguably the easiest way to assess company's ROE is to compare it with the average in its industry. Importantly, this is far from a perfect measure, because companies differ significantly within the same industry classification. As shown in the graphic below, BayWa has a lower ROE than the average (9.9%) in the Trade Distributors industry classification.
That's not what we like to see. We prefer it when the ROE of a company is above the industry average, but it's not the be-all and end-all if it is lower. Nonetheless, it could be useful to double-check if insiders have sold shares recently.
The Importance Of Debt To Return On Equity
Virtually all companies need money to invest in the business, to grow profits. That cash can come from retained earnings, issuing new shares (equity), or debt. In the first and second cases, the ROE will reflect this use of cash for investment in the business. In the latter case, the debt used for growth will improve returns, but won't affect the total equity. In this manner the use of debt will boost ROE, even though the core economics of the business stay the same.
BayWa's Debt And Its 4.5% ROE
BayWa clearly uses a significant amount of debt to boost returns, as it has a debt to equity ratio of 2.66. Its ROE isn't too bad, but it would probably be very disappointing if the company had to stop using debt. Investors should think carefully about how a company might perform if it was unable to borrow so easily, because credit markets do change over time.
The Bottom Line On ROE
Return on equity is one way we can compare the business quality of different companies. A company that can achieve a high return on equity without debt could be considered a high quality business. If two companies have the same ROE, then I would generally prefer the one with less debt.
But ROE is just one piece of a bigger puzzle, since high quality businesses often trade on high multiples of earnings. It is important to consider other factors, such as future profit growth -- and how much investment is required going forward. So you might want to take a peek at this data-rich interactive graph of forecasts for the company.
Of course BayWa may not be the best stock to buy. So you may wish to see this free collection of other companies that have high ROE and low debt.
If you spot an error that warrants correction, please contact the editor at editorial-team@simplywallst.com. This article by Simply Wall St is general in nature. It does not constitute a recommendation to buy or sell any stock, and does not take account of your objectives, or your financial situation. Simply Wall St has no position in the stocks mentioned.
We aim to bring you long-term focused research analysis driven by fundamental data. Note that our analysis may not factor in the latest price-sensitive company announcements or qualitative material. Thank you for reading.
