Is Bell Financial Group's (ASX:BFG) 133% Share Price Increase Well Justified?

The most you can lose on any stock (assuming you don't use leverage) is 100% of your money. But on a lighter note, a good company can see its share price rise well over 100%. Long term Bell Financial Group Limited (ASX:BFG) shareholders would be well aware of this, since the stock is up 133% in five years. In the last week the share price is up 2.0%.
Check out our latest analysis for Bell Financial Group
While markets are a powerful pricing mechanism, share prices reflect investor sentiment, not just underlying business performance. One flawed but reasonable way to assess how sentiment around a company has changed is to compare the earnings per share (EPS) with the share price.
During five years of share price growth, Bell Financial Group achieved compound earnings per share (EPS) growth of 45% per year. The EPS growth is more impressive than the yearly share price gain of 18% over the same period. So it seems the market isn't so enthusiastic about the stock these days. The reasonably low P/E ratio of 10.32 also suggests market apprehension.
You can see below how EPS has changed over time (discover the exact values by clicking on the image).
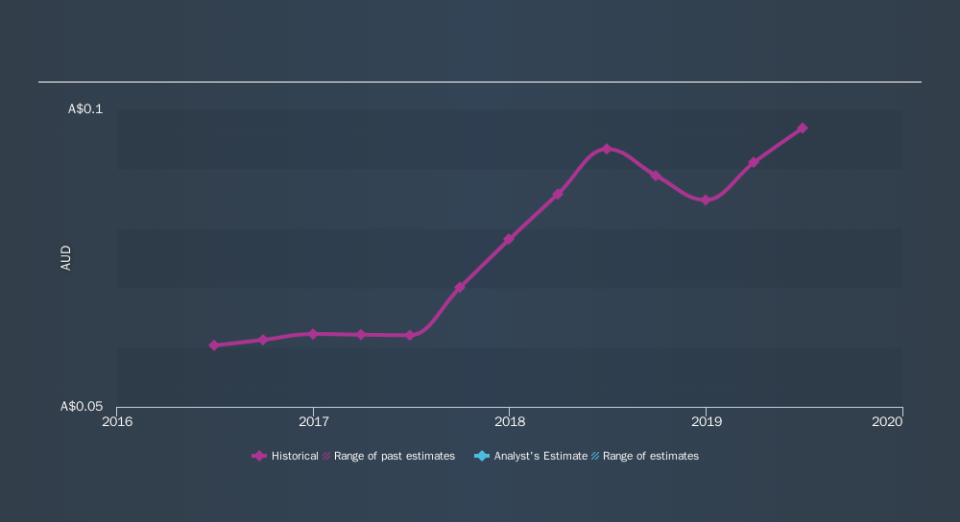
Dive deeper into Bell Financial Group's key metrics by checking this interactive graph of Bell Financial Group's earnings, revenue and cash flow.
What About Dividends?
It is important to consider the total shareholder return, as well as the share price return, for any given stock. Whereas the share price return only reflects the change in the share price, the TSR includes the value of dividends (assuming they were reinvested) and the benefit of any discounted capital raising or spin-off. Arguably, the TSR gives a more comprehensive picture of the return generated by a stock. In the case of Bell Financial Group, it has a TSR of 261% for the last 5 years. That exceeds its share price return that we previously mentioned. And there's no prize for guessing that the dividend payments largely explain the divergence!
A Different Perspective
Bell Financial Group provided a TSR of 11% over the last twelve months. Unfortunately this falls short of the market return. It's probably a good sign that the company has an even better long term track record, having provided shareholders with an annual TSR of 29% over five years. Maybe the share price is just taking a breather while the business executes on its growth strategy. Importantly, we haven't analysed Bell Financial Group's dividend history. This free visual report on its dividends is a must-read if you're thinking of buying.
If you would prefer to check out another company -- one with potentially superior financials -- then do not miss this free list of companies that have proven they can grow earnings.
Please note, the market returns quoted in this article reflect the market weighted average returns of stocks that currently trade on AU exchanges.
We aim to bring you long-term focused research analysis driven by fundamental data. Note that our analysis may not factor in the latest price-sensitive company announcements or qualitative material.
If you spot an error that warrants correction, please contact the editor at editorial-team@simplywallst.com. This article by Simply Wall St is general in nature. It does not constitute a recommendation to buy or sell any stock, and does not take account of your objectives, or your financial situation. Simply Wall St has no position in the stocks mentioned. Thank you for reading.
