Is Belvoir Group PLC's (LON:BLV) Stock's Recent Performance Being Led By Its Attractive Financial Prospects?

Most readers would already be aware that Belvoir Group's (LON:BLV) stock increased significantly by 11% over the past three months. Given that the market rewards strong financials in the long-term, we wonder if that is the case in this instance. Particularly, we will be paying attention to Belvoir Group's ROE today.
ROE or return on equity is a useful tool to assess how effectively a company can generate returns on the investment it received from its shareholders. Put another way, it reveals the company's success at turning shareholder investments into profits.
Check out our latest analysis for Belvoir Group
How Is ROE Calculated?
Return on equity can be calculated by using the formula:
Return on Equity = Net Profit (from continuing operations) ÷ Shareholders' Equity
So, based on the above formula, the ROE for Belvoir Group is:
19% = UK£5.0m ÷ UK£27m (Based on the trailing twelve months to June 2020).
The 'return' is the income the business earned over the last year. That means that for every £1 worth of shareholders' equity, the company generated £0.19 in profit.
Why Is ROE Important For Earnings Growth?
We have already established that ROE serves as an efficient profit-generating gauge for a company's future earnings. Depending on how much of these profits the company reinvests or "retains", and how effectively it does so, we are then able to assess a company’s earnings growth potential. Assuming everything else remains unchanged, the higher the ROE and profit retention, the higher the growth rate of a company compared to companies that don't necessarily bear these characteristics.
Belvoir Group's Earnings Growth And 19% ROE
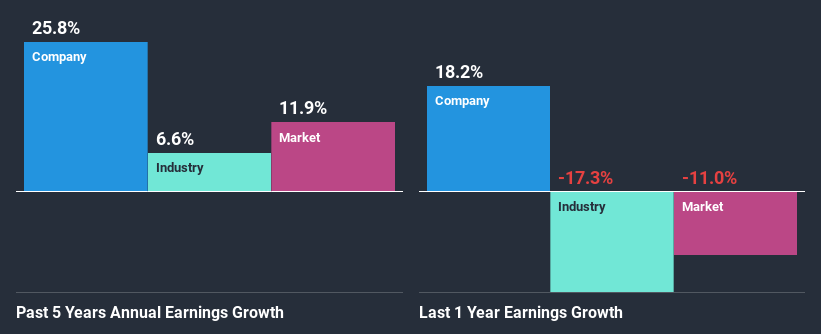
To start with, Belvoir Group's ROE looks acceptable. Further, the company's ROE compares quite favorably to the industry average of 7.4%. Probably as a result of this, Belvoir Group was able to see an impressive net income growth of 26% over the last five years. However, there could also be other causes behind this growth. For example, it is possible that the company's management has made some good strategic decisions, or that the company has a low payout ratio.
Next, on comparing with the industry net income growth, we found that Belvoir Group's growth is quite high when compared to the industry average growth of 6.6% in the same period, which is great to see.
The basis for attaching value to a company is, to a great extent, tied to its earnings growth. What investors need to determine next is if the expected earnings growth, or the lack of it, is already built into the share price. This then helps them determine if the stock is placed for a bright or bleak future. If you're wondering about Belvoir Group's's valuation, check out this gauge of its price-to-earnings ratio, as compared to its industry.
Is Belvoir Group Efficiently Re-investing Its Profits?
The high three-year median payout ratio of 59% (implying that it keeps only 41% of profits) for Belvoir Group suggests that the company's growth wasn't really hampered despite it returning most of the earnings to its shareholders.
Additionally, Belvoir Group has paid dividends over a period of eight years which means that the company is pretty serious about sharing its profits with shareholders. Existing analyst estimates suggest that the company's future payout ratio is expected to drop to 47% over the next three years. However, the company's ROE is not expected to change by much despite the lower expected payout ratio.
Conclusion
Overall, we are quite pleased with Belvoir Group's performance. Especially the high ROE, Which has contributed to the impressive growth seen in earnings. Despite the company reinvesting only a small portion of its profits, it still has managed to grow its earnings so that is appreciable. That being so, a study of the latest analyst forecasts show that the company is expected to see a slowdown in its future earnings growth. Are these analysts expectations based on the broad expectations for the industry, or on the company's fundamentals? Click here to be taken to our analyst's forecasts page for the company.
This article by Simply Wall St is general in nature. It does not constitute a recommendation to buy or sell any stock, and does not take account of your objectives, or your financial situation. We aim to bring you long-term focused analysis driven by fundamental data. Note that our analysis may not factor in the latest price-sensitive company announcements or qualitative material. Simply Wall St has no position in any stocks mentioned.
Have feedback on this article? Concerned about the content? Get in touch with us directly. Alternatively, email editorial-team@simplywallst.com.
