Best (and Worst) Cities for Car Lovers

When it comes to choosing the best and worst cities for car lovers, there are some choices that are just obvious. New York, for example, has outstanding public transportation — along with high taxes and lots of traffic — making it a clear front-runner for the title of worst city for car lovers. But on the other side of the equation, not many would easily name a small city in middle America as the best place in the country for car lovers.
Find Out: Auto Expenses You Can Expect If You Haven’t Driven During Quarantine
GOBankingRates analyzed the 75 most populous cities in America using nine factors to calculate the best and worst states for car lovers. Part of the formula involved considering the percentage of households that had access to between zero and four or more vehicles, along with typical factors such as average commute time, gas prices and registration fees. These are the cities that make vehicle owners smile the most.
Last updated: Feb. 25, 2021

The Best Cities for Car Lovers
Low costs, breezy commute times and easy access to vehicles all combine to make these 25 cities the best places to own a car.
It’s no doubt hard for San Francisco residents, who are stuck with the highest gas prices in the country at $3.84 per gallon, to imagine paying $2.16 for that same gallon of gas in Plano, Texas. Residents of Minnesota’s Twin Cities of Minneapolis and St. Paul, who pay the highest typical registration fee in the country at $471.61, are no doubt jealous of the two cities in Colorado — Aurora and Colorado Springs — that have no fee at all.
If you’re looking to keep your vehicle costs low and spend less time in your car, check out these cities.
25. Aurora, Colorado
Average commute time (minutes): 29.3
Average gas price: $2.41
Transportation cost-of-living index: 141.4
Annual vehicle expenses: $8,722.97
Typical registration fee: $0

24. Austin, Texas
Average commute time (minutes): 24.1
Average gas price: $2.32
Transportation cost-of-living index: 130.6
Annual vehicle expenses: $8,056.71
Typical registration fee: $50.75

23. Indianapolis
Average commute time (minutes): 23.1
Average gas price: $2.40
Transportation cost-of-living index: 103.8
Annual vehicle expenses: $6,403.42
Typical registration fee: $21.35
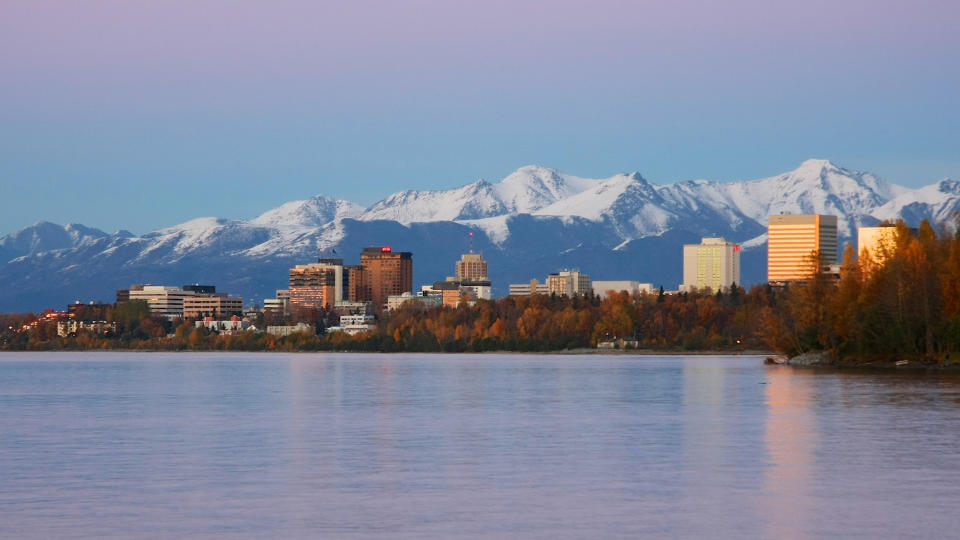
22. Anchorage, Alaska
Average commute time (minutes): 18.9
Average gas price: $3.07
Transportation cost-of-living index: 117.2
Annual vehicle expenses: $7,230.07
Typical registration fee: $50

21. Nashville, Tennessee
Average commute time (minutes): 24.6
Average gas price: $2.39
Transportation cost-of-living index: 115.9
Annual vehicle expenses: $7,149.87
Typical registration fee: $23.75
Credit Score: 30 Things You Do That Can Mess Up Your Credit Score

20. Charlotte, North Carolina
Average commute time (minutes): 25.3
Average gas price: $2.33
Transportation cost-of-living index: 112.6
Annual vehicle expenses: $6,946.29
Typical registration fee: $36

19. Kansas City, Missouri
Average commute time (minutes): 21.80
Average gas price: $2.25
Transportation cost-of-living index: 101.70
Annual vehicle expenses: $6,273.87
Typical registration fee: $51

18. Fort Worth, Texas
Average commute time (minutes): 27
Average gas price: $2.23
Transportation cost-of-living index: 135.80
Annual vehicle expenses: $8,377.50
Typical registration fee: $50.75
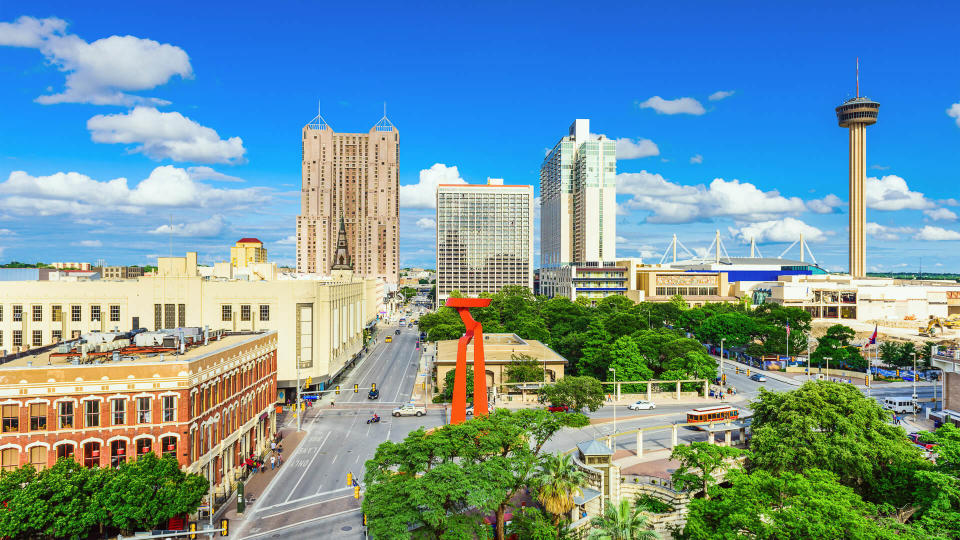
17. San Antonio
Average commute time (minutes): 24.10
Average gas price: $2.23
Transportation cost-of-living index: 116.90
Annual vehicle expenses: $7,211.56
Typical registration fee: $50.75

16. Raleigh, North Carolina
Average commute time (minutes): 23.40
Average gas price: $2.42
Transportation cost-of-living index: 100.10
Annual vehicle expenses: $6,175.17
Typical registration fee: $36
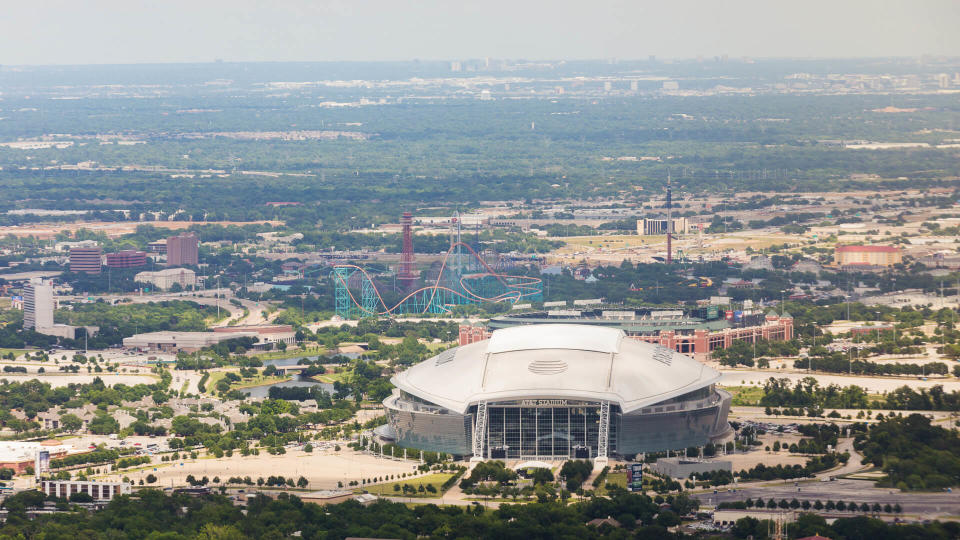
15. Arlington, Texas
Average commute time (minutes): 27.20
Average gas price: $2.23
Transportation cost-of-living index: 136.30
Annual vehicle expenses: $8,408.35
Typical registration fee: $50.75

14. Lexington, Kentucky
Average commute time (minutes): 20.90
Average gas price: $2.23
Transportation cost-of-living index: 101
Annual vehicle expenses: $6,230.69
Typical registration fee: $21

13. Albuquerque, New Mexico
Average commute time (minutes): 21.20
Average gas price: $2.35
Transportation cost-of-living index: 105.70
Annual vehicle expenses: $6,520.63
Typical registration fee: $44.50
Find Out: Are You Eligible for a Third Stimulus Check – and If So, When Will You Get Yours?

12. Greensboro, North Carolina
Average commute time (minutes): 20.70
Average gas price: $2.39
Transportation cost-of-living index: 85.50
Annual vehicle expenses: $5,274.50
Typical registration fee: $36

11. El Paso, Texas
Average commute time (minutes): 22.70
Average gas price: $2.39
Transportation cost-of-living index: 107.60
Annual vehicle expenses: $6,637.84
Typical registration fee: $50.75

10. Tulsa, Oklahoma
Average commute time (minutes): 18.40
Average gas price: $2.18
Transportation cost-of-living index: 105.30
Annual vehicle expenses: $6,495.96
Typical registration fee: $85

9. Fort Wayne, Indiana
Average commute time (minutes): 20.90
Average gas price: $2.38
Transportation cost-of-living index: 93
Annual vehicle expenses: $5,737.17
Typical registration fee: $21.35

8. Omaha, Nebraska
Average commute time (minutes): 18.70
Average gas price: $2.32
Transportation cost-of-living index: 95.80
Annual vehicle expenses: $5,909.90
Typical registration fee: $15

7. Colorado Springs, Colorado
Average commute time (minutes): 21.80
Average gas price: $2.45
Transportation cost-of-living index: 106.50
Annual vehicle expenses: $6,569.99
Typical registration fee: $0

6. Oklahoma City
Average commute time (minutes): 21.30
Average gas price: $2.19
Transportation cost-of-living index: 110.20
Annual vehicle expenses: $6,798.24
Typical registration fee: $85

5. Corpus Christi, Texas
Average commute time (minutes): 19.20
Average gas price: $2.23
Transportation cost-of-living index: 93.30
Annual vehicle expenses: $5,755.68
Typical registration fee: $50.75

4. Lincoln, Nebraska
Average commute time (minutes): 18.30
Average gas price: $2.49
Transportation cost-of-living index: 86.50
Annual vehicle expenses: $5,336.19
Typical registration fee: $15

3. Virginia Beach, Virginia
Average commute time (minutes): 23.70
Average gas price: $2.31
Transportation cost-of-living index: 115.30
Annual vehicle expenses: $7,112.86
Typical registration fee: $40.75

2. Plano, Texas
Average commute time (minutes): 26.50
Average gas price: $2.16
Transportation cost-of-living index: 100
Annual vehicle expenses: $6,169
Typical registration fee: $50.75

1. Wichita, Kansas
Average commute time (minutes): 18.20
Average gas price: $2.20
Transportation cost-of-living index: 92.80
Annual vehicle expenses: $5,724.83
Typical registration fee: $35

The Worst Cities for Car Lovers
If you live in one of the worst cities for car lovers, you probably don’t need a study to tell you. High costs and slow commutes are the scourge of many big cities, and the 25 listed ahead all share some unfortunate combination of the two. New York, for example, has both the longest commute and the highest annual vehicle expenses in the nation, no doubt contributing to the fact that a whopping 54.46% of residents don’t even have a single vehicle available. You’ll have to really love your car if you want to own one in these cities.

25. St. Paul, Minnesota
Average commute time (minutes): 23.70
Average gas price: $2.49
Transportation cost-of-living index: 127.20
Annual vehicle expenses: $7,846.97
Typical registration fee: $471.61
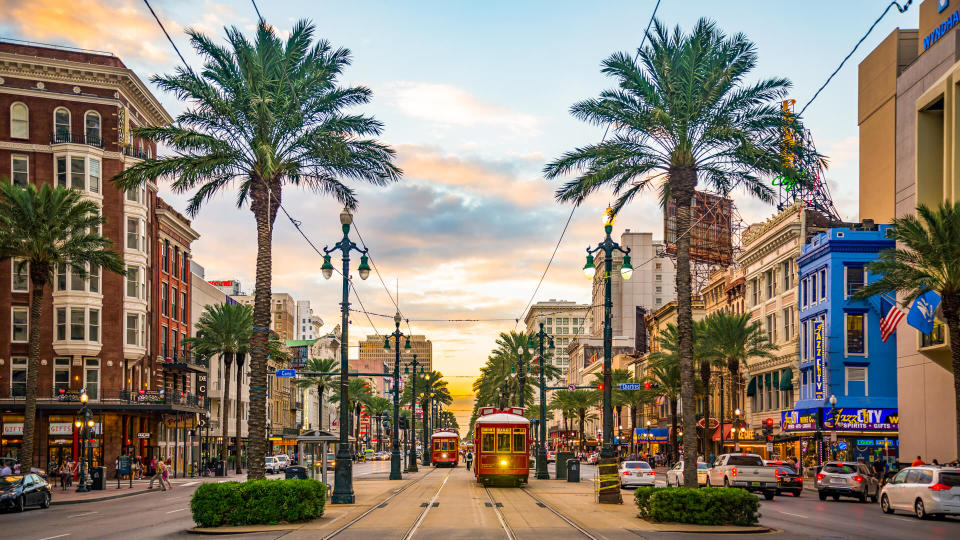
24. New Orleans
Average commute time (minutes): 23.80
Average gas price: $2.17
Transportation cost-of-living index: 155
Annual vehicle expenses: $9,561.95
Typical registration fee: $37.17

23. St. Louis
Average commute time (minutes): 24.10
Average gas price: $2.38
Transportation cost-of-living index: 113.80
Annual vehicle expenses: $7,020.32
Typical registration fee: $51

22. Cincinnati
Average commute time (minutes): 22.60
Average gas price: $2.54
Transportation cost-of-living index: 108.50
Annual vehicle expenses: $6,693.37
Typical registration fee: $34.50

21. Sacramento, California
Average commute time (minutes): 25.40
Average gas price: $3.49
Transportation cost-of-living index: 132.80
Annual vehicle expenses: $8,192.43
Typical registration fee: $46
Auto: 23 Car Upgrades That Are Worth the Price

20. Atlanta
Average commute time (minutes): 26.30
Average gas price: $2.56
Transportation cost-of-living index: 144
Annual vehicle expenses: $8,883.36
Typical registration fee: $20

19. Portland, Oregon
Average commute time (minutes): 26.10
Average gas price: $3.14
Transportation cost-of-living index: 147.40
Annual vehicle expenses: $9,093.11
Typical registration fee: $43
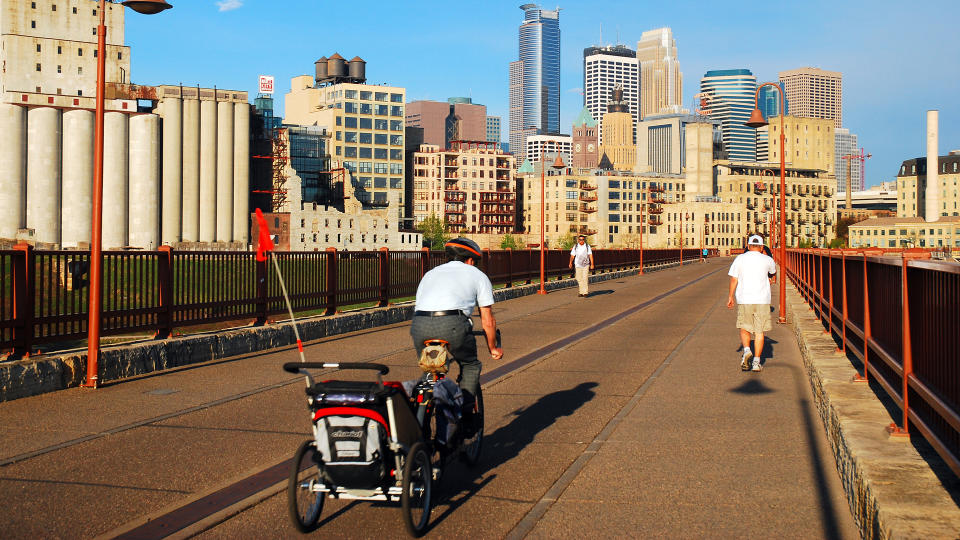
18. Minneapolis
Average commute time (minutes): 22.90
Average gas price: $2.53
Transportation cost-of-living index: 126.7
Annual vehicle expenses: $7,816.12
Typical registration fee: $471.61

17. Cleveland
Average commute time (minutes): 24.10
Average gas price: $2.65
Transportation cost-of-living index: 105
Annual vehicle expenses: $6,477.45
Typical registration fee: $34.50

16. Pittsburgh
Average commute time (minutes): 23.80
Average gas price: $2.80
Transportation cost-of-living index: 121.20
Annual vehicle expenses: $7,476.83
Typical registration fee: $36
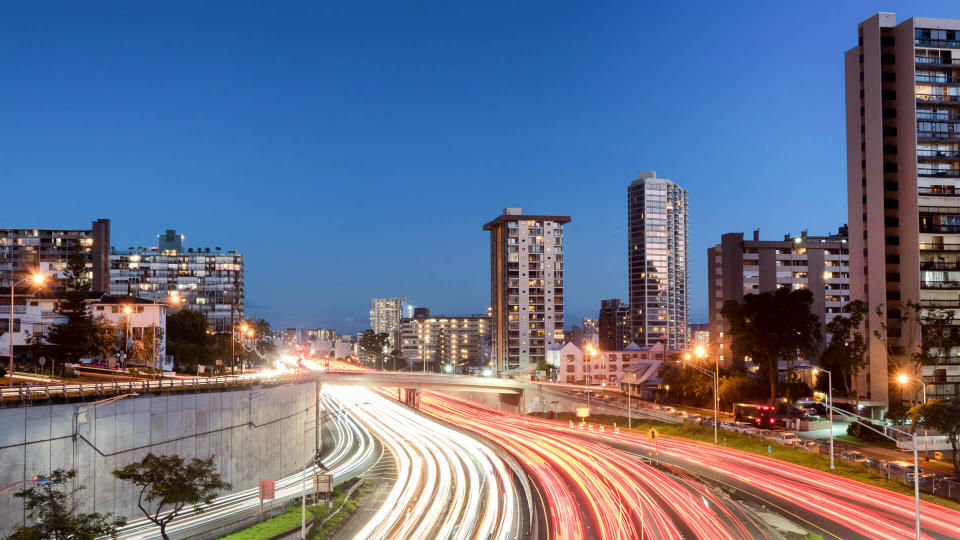
15. Honolulu
Average commute time (minutes): 23.40
Average gas price: $3.55
Transportation cost-of-living index: 142.60
Annual vehicle expenses: $8,796.99
Typical registration fee: $115
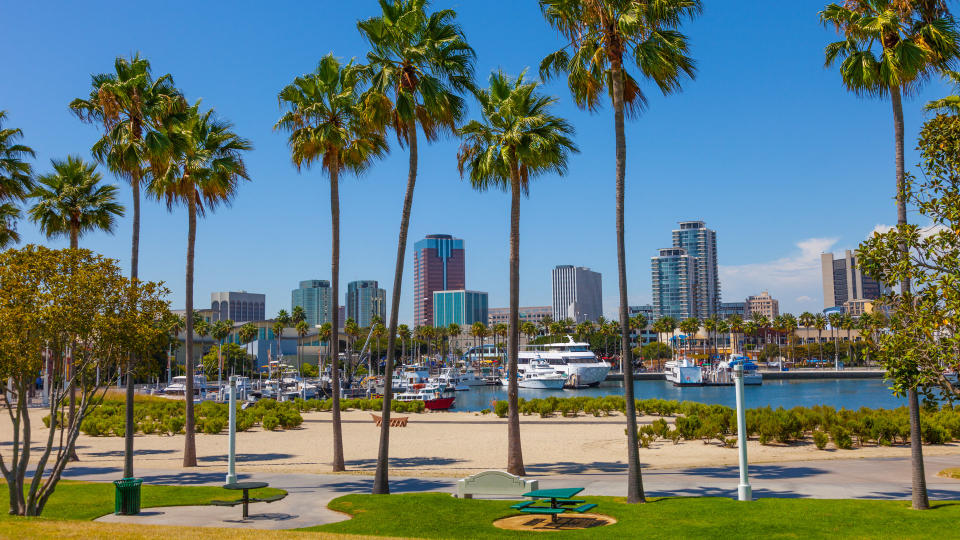
14. Long Beach, California
Average commute time (minutes): 30.40
Average gas price: $3.66
Transportation cost-of-living index: 182.30
Annual vehicle expenses: $11,246.09
Typical registration fee: $46

13. Miami
Average commute time (minutes): 28.10
Average gas price: $2.48
Transportation cost-of-living index: 169.70
Annual vehicle expenses: $10,468.79
Typical registration fee: $257.50

12. Seattle
Average commute time (minutes): 27.50
Average gas price: $3.41
Transportation cost-of-living index: 156.50
Annual vehicle expenses: $9,654.49
Typical registration fee: $30

11. Los Angeles
Average commute time (minutes): 30.90
Average gas price: $3.66
Transportation cost-of-living index: 190.70
Annual vehicle expenses: $11,764.28
Typical registration fee: $46
10. Oakland, California
Average commute time (minutes): 31.90
Average gas price: $3.67
Transportation cost-of-living index: 131.70
Annual vehicle expenses: $8,124.57
Typical registration fee: $46

9. Baltimore
Average commute time (minutes): 30.70
Average gas price: $2.41
Transportation cost-of-living index: 144.60
Annual vehicle expenses: $8,920.37
Typical registration fee: $135

8. Detroit
Average commute time (minutes): 26.40
Average gas price: $2.69
Transportation cost-of-living index: 208
Annual vehicle expenses: $12,831.52
Typical registration fee: $234
Read: The 5 Best Apps and Websites To Buy a Car
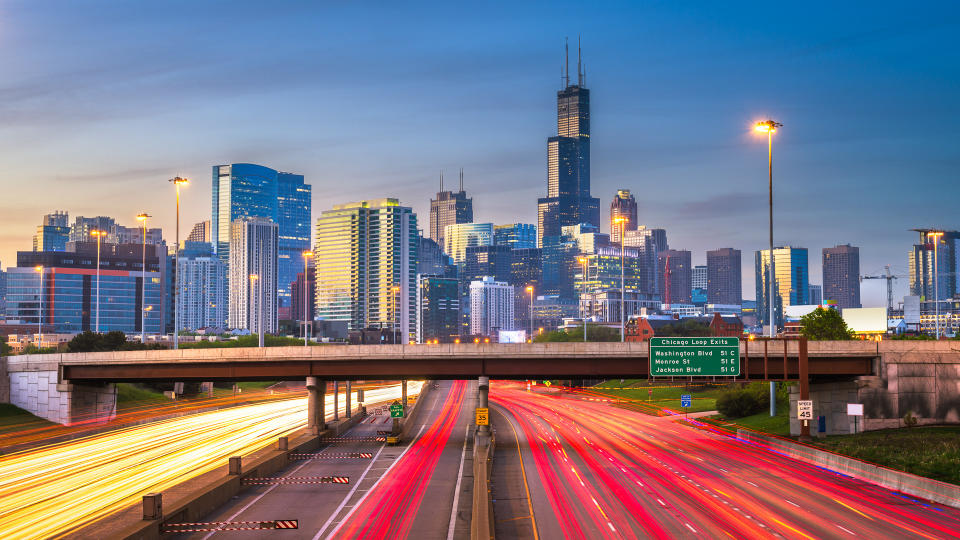
7. Chicago
Average commute time (minutes): 34.60
Average gas price: $2.97
Transportation cost-of-living index: 159.80
Annual vehicle expenses: $9,858.06
Typical registration fee: $101

6. Philadelphia
Average commute time (minutes): 32.90
Average gas price: $2.78
Transportation cost-of-living index: 162.40
Annual vehicle expenses: $10,018.46
Typical registration fee: $36

5. Boston
Average commute time (minutes): 30.40
Average gas price: $2.81
Transportation cost-of-living index: 151.70
Annual vehicle expenses: $9,358.37
Typical registration fee: $60

4. Newark, New Jersey
Average commute time (minutes): 35.50
Average gas price: $2.73
Transportation cost-of-living index: 114.10
Annual vehicle expenses: $7,038.83
Typical registration fee: $84

3. Jersey City, New Jersey
Average commute time (minutes): 36.80
Average gas price: $2.61
Transportation cost-of-living index: 180.70
Annual vehicle expenses: $11,147.38
Typical registration fee: $84
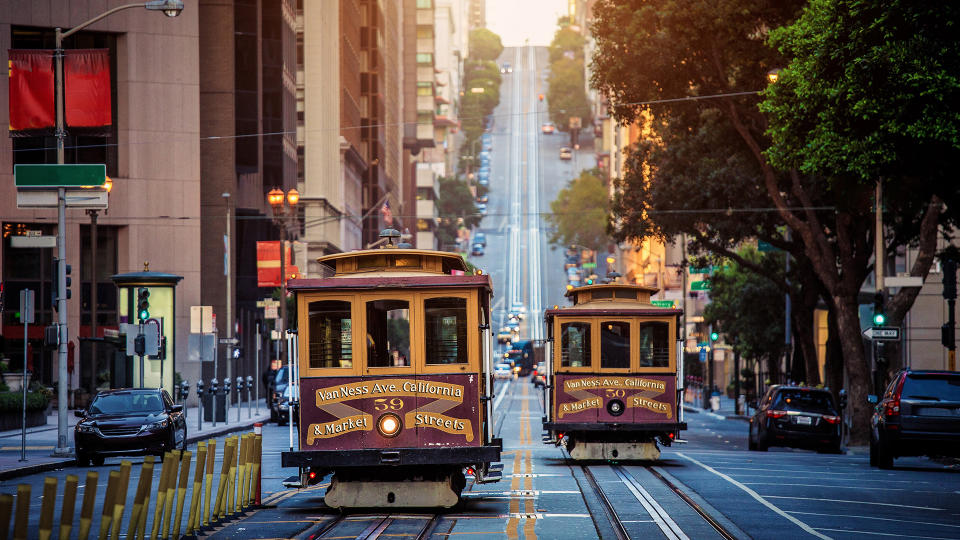
2. San Francisco
Average commute time (minutes): 32.80
Average gas price: $3.84
Transportation cost-of-living index: 176.80
Annual vehicle expenses: $10,906.79
Typical registration fee: $46

1. New York
Average commute time (minutes): 40.80
Average gas price: $3.01
Transportation cost-of-living index: 211.50
Annual vehicle expenses: $13,047.44
Typical registration fee: $53.75
More From GOBankingRates
Methodology: GOBankingRates analyzed the 75 most populous cities according to the United States Census Bureau in order to find the best and worst cities for car lovers. The study looked at the cities along the following factors: (1) average commute time in minutes, sourced from the United States Census Bureau’s 2017 American Community Survey; (2) gas prices by county, sourced from AAA; (3) annual vehicle expenses, which were defined as “vehicle purchases (net outlay)” + “vehicle finance charges” + “maintenance and repairs” + “vehicle insurance” per the Bureau of Labor Statistic’s Consumer Expenditure Survey for the third quarter 2017 through the second quarter 2018. Each city’s annual vehicle expenses were then factored out using each city’s Sperling’s Best Places’ transportation cost of living index; (4) registration fees by state according to documentation used at the 2018 National Conference of State Legislatures; (5) percent of households that have access to zero vehicles; (6) percent of households that have access to one vehicle; (7) percent of households that have access to three vehicles; and (9) percent of households that have access to four or more vehicles, all sourced from the United States Census Bureau’s 2017 American Community Survey. These nine factors were then scored, with the lowest score being best, and combined to give a final total. In final calculations, factor four was given a weight of 0.5, factor seven was given a weight of 0.75, factors two and nine were given a weight of 1.5 times and factor five was given a weight of 2 times. All data was collected and up to date as of Sept. 3, 2019.
This article originally appeared on GOBankingRates.com: Best (and Worst) Cities for Car Lovers

