Better Buy: Plug Power vs. Bloom Energy
Investors in fuel-cell stocks Plug Power (NASDAQ: PLUG) and Bloom Energy (NYSE: BE) have had a lot to celebrate in 2019. While the S&P 500 has climbed 16%, shares of Plug Power have more than doubled, jumping 109%, and Bloom Energy has risen more than 24%. For those itching to gain some fuel-cell exposure in their portfolios, now may hardly seem like the most opportune time, considering the stocks' recent rises, but that's not to say that, assuming a longer time horizon, one of these stocks can't power higher returns than the other.
Plug Power has been publicly traded since 1999, and Bloom Energy, with its IPO last summer, is a newer face in the market. So let's plug in and get to know these companies a little better to see which one presents investors with the best buying opportunity.

Image source: Getty Images.
Checking in with the income
There are many things that differentiate Plug Power and Bloom Energy from their fuel-cell peers, but one notable way in which they stand out is their considerable revenue growth. Unlike Ballard Power Systems (NASDAQ: BLDP), whose top line has ebbed recently, Plug Power and Bloom Energy have experienced significant sales growth. From 2016 to 2018, Plug Power's top line has risen 111%, while Bloom Energy's has soared 256%.
But Bloom Energy outshines Plug Power in its ability to generate stronger margins in several categories: gross profit, operating income, and EBITDA.
Company | Gross Profit | Gross Margin | Operating Income | Operating Margin | EBITDA | EBITDA Margin |
|---|---|---|---|---|---|---|
Plug Power | $2.62 million | 1.5% | ($69.5) million | (39.8%) | ($57.8) million | (33.1%) |
Bloom Energy | $117.1 million | 15.8% | ($153.9) million | (20.7%) | ($128.7) million | (17.3%) |
Data Source: Morningstar. All figures for fiscal year 2018.
Many companies think that EBITDA doesn't necessarily reflect the right things in their business, so let;s look a non-GAAP metric, adjusted EBITDA, as well. Because both companies adjust for different variables in arriving at their adjusted EBITDA figures, the comparison between the two is not exactly apples-to-apples, so it's more logical to consider the companies and their previous performances. While Plug Power reported Q4 2018 positive adjusted EBITDA for the first time in the company's history; it only translated to adjusted EBITDA of negative $17.5 million for the entire year. On the other hand, Bloom Energy reported adjusted EBITDA of $14 million in Q4 2018, translating to $66.9 million for the full year 2018.
Winner: Bloom Energy
Delicate balancing acts
Apparently, Bloom Energy has the edge when it comes to the income statement, but it's equally important to check in and see how the companies compare regarding their financial health -- especially in light of the fact that neither is profitable.
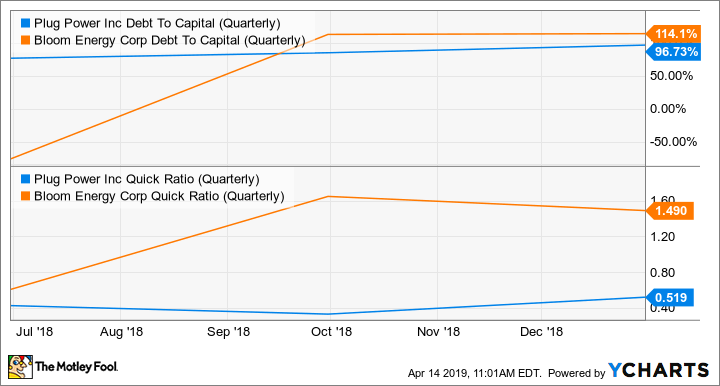
PLUG Debt To Capital (Quarterly) data by YCharts.
Because neither company can generate cash through their operations, both have had to rely on raising capital through the issuance of debt -- and a lot of it. While Bloom Energy's high debt-to-capital ratio over 1.1 raises a red flag, it's not as if Plug Power's position is that much more secure, as its ratio hovers just below 1.0.
Considering the burdensome balance sheets of the two companies, let's take a look at their liquidity, specifically their quick ratios, to see if they have enough liquid assets like cash to pay for their current liabilities. Although Bloom Energy carries a hefty amount of debt, its quick ratio of 1.49 suggests that it's well equipped to handle its immediate liabilities, while Plug Power's quick ratio of 0.51 suggests the company finds itself in a more tenuous position.
Winner: Bloom Energy
Perusing the price tag
Since neither company churns out profit or generates positive cash flow, the traditional price-to-earnings and price-to-cash flow metrics serve little use. Instead, we can consider the two stocks on their sales multiples. Because Bloom Energy has been trading less than a year, our historical perspective is limited; however, the stock's current value at 0.89 times trailing sales is a steep discount to the 5.4 times sales multiple that it sported last October. And in comparison to Plug Power, the bargain seems even more attractive because Plug Power's stock currently trades at 3.25 times trailing sales. Although Plug Power's valuation is less expensive than its five-year average multiple of 5.57, Bloom Energy's valuation appears much more compelling.
Winner: Bloom Energy
The electric takeaway
While Plug Power has made progress in restoring trust with investors and improving its financial health, it's uncertain whether the company can continue on this trajectory. It will take more than a single quarter of positive adjusted EBITDA to prove that it has turned a corner and is ready to count itself among profitable companies. And while an investment in Bloom Energy also carries with it a hefty amount of risk, its more attractive financials and price tag suggest that it represents the better opportunity for investors at the moment.
More From The Motley Fool
Scott Levine has no position in any of the stocks mentioned. The Motley Fool has no position in any of the stocks mentioned. The Motley Fool has a disclosure policy.

