Can we better predict future hitting performance for MLB using a new stat? We tried to find out.
At some point during the doldrums of the baseball off-season, I had a thought – scary, I know.
The unknown is at the core of baseball. Of all the major American sports, it is the most difficult to predict. This in spite of being the one where performance is arguably easiest to quantify.
But over the years, the public has become better and better at projecting what the most likely outcomes are, even despite its volatile nature.
I wanted to see if there was a way to potentially advance that ability.
Is there a way to better predict future hitting performance using only skill as opposed to outcomes? What if we can drown out the noise of outcome-based metrics in a sport where luck often has a hand in those while still predicting future performance?
So I set out to see if I could answer those questions.
Introducing HOBBS.
What HOBBS is
HOBBS, which is named after Roy Hobbs, the main character in The Natural, is, in short, a way to measure skill. It reflects which players best show the underlying skills that are most conducive to repeatable success at the plate.
It takes into account 12 different metrics that are skill-based and ignore outcomes, then weighs how each player performs relative to the league in each one. From there, it combines those league-weighted metrics and gives each component a different weight based upon its importance in regards to offensive success. There is then an opponent and luck adjustment, which gives us our final HOBBS for each player on a scale where 100 is league average.
For reference, Aaron Judge led baseball with a 137 HOBBS last year and Yordan Alvarez was second at 132.
The goal is to have one number that, by comprehensively measuring a batter’s skill level and ignoring outcomes, will better assist in predicting future performance.
And, while the model is still a work in progress, the results of the first public iteration of it are positive: A batter’s HOBBS in Year 1 has a higher correlation to his wOBA (and wRC+, for that matter) in Year 2 than both Year 1 wOBA, career wOBA and Statcast’s predictive wOBA-adjacent metric, xwOBA (expected wOBA) in Year 1.
It also seems to be effective at predicting blanket improved or worse performance in an upcoming season.
What HOBBS isn’t
First things first here: I’m just a guy who writes about baseball. I’m not a data analyst. Heck, I haven’t even taken a math class since high school. This model assuredly isn’t perfect, nor is it without flaws.
This isn't a final product. I've been working on it for a couple of months now when not parenting a 1-year-old or writing other baseball stories. I want to improve upon HOBBS in future versions. I'm open to advice!
It’s not meant to measure precisely who was the “best” hitter in any given year, but who was best at exhibiting skills that are most repeatable and conducive for success.
It’s also not an apples-to-apples comparison to wRC+ in terms of scale – in other words, a 120 HOBBS doesn’t mean it’s saying that player “deserved” a 120 wRC+.
The nitty gritty of how it’s calculated
If thoughts of math make your eyes glaze over, feel free to skip this part. I won’t be offended.
The first question to the whole process was the most important one: How do you measure skill using publicly-available data?
To start, I jotted down roughly 100 different potential metrics that might possibly account for some type of hitting skill and ran linear regressions to determine their relationship to wRC+, which represents all-inclusive offensive performance. The metrics tested could not be outcome-based at all; so rather than look at walk rate, for example, I looked into components that are underneath walk rate such as chase rate and going all the way down to tested very specific numbers such as swing rate in even counts to determine correlation to offensive performance. (As you can imagine, the former in this case has a stronger relationship than the latter to wRC+.)
From there, I selected six metrics to include in our model. These were not the six metrics with the highest correlation – though they were all near the top of the list – but the six metrics that each measure different skills to varying degrees that have the highest correlation.
After selecting the initial six metrics to include, I ran into a problem later down the road. In HOBBS, a batter’s performance in each category is weighed against MLB average; but because some numbers (were percentages with much higher variance and others (such as 90th percentile exit velocity) were raw numbers with less variance, it created challenges in that the range from the leader the last place differed too much from category to category. I remedied this by selecting all metrics that were percentages – save for sprint speed, which was easily adjustable to fit the same scale as the other components.
I ran linear regressions on hundreds of different combinations of “secondary” components to go along with the six metrics locked into HOBBS to find the what combination of 12 components had the highest correlation with the following year's wOBA for qualifying players.
Once it was clear which 12 components were going to be used, I experimented further with the weights assigned the combination that most accurately predicts future performance from year to year.
Without completely divulging what the specific metrics being used are, the skills being weighed, in order, are: ability to consistently hit the ball hard; ability to consistently launch the ball at an ideal vertical angle; maximizing distance on fly balls; optimizing pitch selection; chase rate; speed; and avoiding contact that produces minimal chances of success. There are other inputs being measured, as well, but those are much more minor in how they are weighted.
Some of the early findings
I ran regressions to determine the R-Squared value of each year of HOBBS with the following season's wOBA (except for those involving the shortened 2020 season) since 2016, the year that all the necessary Statcast data was made available. The HOBBS R-Squared value was greater than each of wRC+, wOBA and xwOBA each year. There was a .6107 R-Squared for year-to-year HOBBS correlation. These were all rudimentary tests – again, not a math guy here – but do show some encouraging signs about HOBBS' potential value.
I also wanted to see how effectively HOBBS could predict blanket improvement or decline in output-based performance year over year. To do this, I took the entire sample of players with at least 200 PA in both 2021 and 2022 and found the difference between every player's 2021 rank among the sample in wOBA and HOBBS. That gave me a sample of 145 players HOBBS anticipated would improve in 2022. Taking the top 70% of players from that group (thus ignoring those more likely to be in the margin of error), 78.3% of them saw their wOBA rank among the rest of the league jump the following year. I then did the same with players HOBBS anticipated would decline and had a 75.3% accuracy rate.
I then repeated the exercise on 2018 to 2019 (again, avoiding anything from 2020). 77% of projected improvements from 2018 did perform better by wOBA rank in 2019. 78.9% of projected decliners performed worse.
There is also a three-year HOBBS component in the works, but I wasn't able to get enough testing on it done while in Arizona for it to be ready to run yet. Some very early (and incomplete) testing, though, does show it may be more predictive than using one-year HOBBS, which would make sense.
For the spreadsheet with the full HOBBS leaderboard from 2022 (min. 200 PA), click here.
Five takeaways
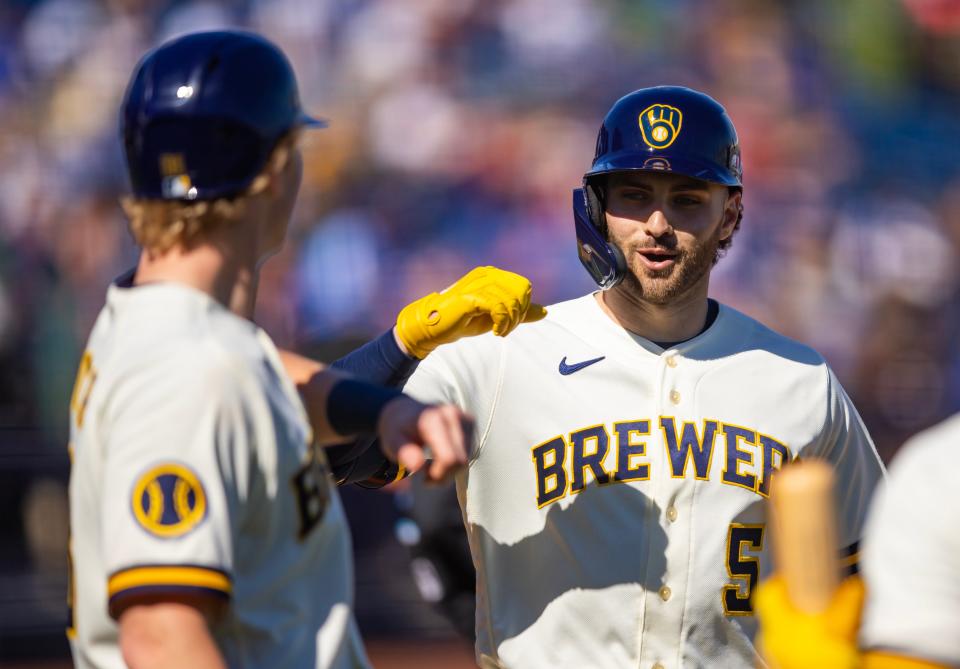
HOBBS likes the Brewers offense
Good news for the Brewers: HOBBS is optimistic about the lineup. Milwaukee’s projected opening day offensive depth chart – not including prospects without big-league experience – combined for an average 104 mark last year.
That’s the highest mark in the NL Central.
Player | 2022 HOBBS |
Christian Yelich | 117 |
Willy Adames | 112 |
Garrett Mitchell | 110 |
William Contreras | 109 |
Mike Brosseau | 107 |
Luke Voit | 106 |
Rowdy Tellez | 103 |
Victor Caratini | 103 |
Brian Anderson | 102 |
Tyrone Taylor | 101 |
Luis Urías | 100 |
Jesse Winker | 95 |
Owen Miller | 91 |
Christian Yelich led the Brewers in HOBBS last year and finished just outside the top 20 in all of baseball.
Owen Miller and Jesse Winker are the only players who were below league average last year.
Winker has historically been highly-rated by the model and his pitch selection, according to HOBBS, is maybe the most elite individual skill on the Brewers as it graded out at 75% better than league average in those components.
The early returns on Garrett Mitchell were positive, although his total of 68 plate appearances still falls into small sample size territory. Mitchell’s 110 HOBBS was third-highest on the team last year behind only Yelich and Keston Hiura (112), who was informed Friday he will not be making the opening day roster.
Mitchell’s overall HOBBS rank among qualified hitters would have been 43 spots lower than his wOBA rank, but considering his wOBA was heavily driven by a .548 BABIP.
Here are the Brewers whose HOBBS rank was highest compared to their wOBA rank…
Victor Caratini: +90
Christian Yelich: +82
Brian Anderson: +78
Willy Adames: +69
Luke Voit: +60
…and those whose ranks were the lowest.
Jesse Winker: -114
Luis Urias: -98
Rowdy Tellez: -60
Tyrone Taylor: -40
It may be worth noting, too, that HOBBS believes that two hitters the Brewers traded away last year both may have outperformed their skill level: Hunter Renfroe’s wOBA rank was 107 spots higher than his HOBBS and Kolten Wong’s was 136 higher.
Here are last year’s top 20 hitters by HOBBS.
Aaron Judge - 137
Yordan Alvarez - 132
Teoscar Hernández - 124
Freddie Freeman - 123
Matt Chapman - 122
J.D. Davis - 121
Bryan De La Cruz - 121
Eloy Jiménez - 121
Kyle Schwarber -120
Shohei Ohtani - 119
Mookie Betts - 119
Austin Riley - 118
Matt Carpenter -118
Mike Trout - 118
Ji-Man Choi - 118
Taylor Ward - 118
Michael Brantley - 117
Ronald Acuña Jr. - 117
Bryce Harper - 117
Julio Rodríguez - 117
The Pirates offense is…interesting?
Vegas’ over/under for wins for the Pirates is 67.5, but HOBBS is optimistic about the prospects of Pittsburgh’s offense. It may not be good enough to sniff a playoff spot (or even playoff contention) but their projected offensive depth chart averaged a 100 HOBBS – right at league average – last year.
Ji-Man Choi (118 HOBBS), Andrew McCutchen (111) and Ke’Bryan Hayes (110) are all model favorites, especially relative to their final numbers last year.
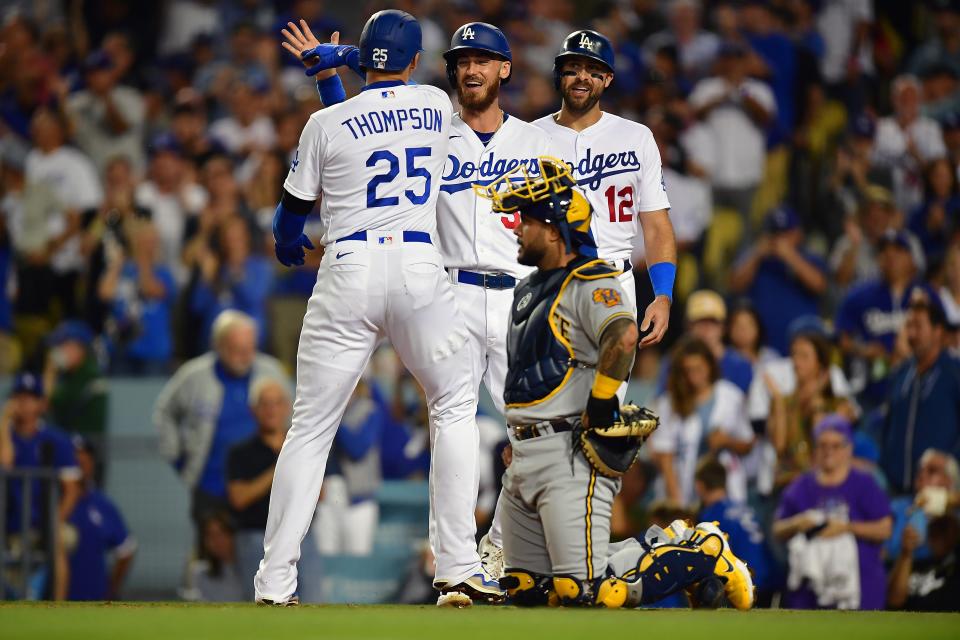
The Dodgers are (still) loaded
Sure, okay, nobody is actually going to sleep on the Dodgers of all teams, but bear with me for a second. After a relatively quiet off-season, the Dodgers have been passed up by the Padres in the minds of many in the NL West race. But don’t be so quick to knock the Dodgers.
Here’s the Dodgers projected lineup with each player’s HOBBS and rank (out of 416 qualifying players):
Mookie Betts (119, T-10)
Freddie Freeman (123, 4)
Will Smith (113, T-37)
Max Muncy (116, T-23)
J.D. Martinez (107, T-102)
David Peralta (105, T-133)
Trayce Thompson (115, T-34)
Miguel Vargas (N/A)
Miguel Rojas (87, T-374)
Not shabby.
A look at breakout performers last year
It can be tricky to try and guess which breakout hitters in any given year can sustain that performance. There isn’t quite enough of a sample size for these types of hitters with HOBBS to see how well the stat can gauge how “real” one-year breakouts are, but here are five players with offensive breakouts in 2022 whose performance HOBBS believes was rooted in sustainable skill.
Trayce Thompson: Everything but his contact is above-average
Jazz Chisholm: His speed is a real factor to his offense and, though he doesn’t always elevate, he began to maximize his fly balls.
Joey Meneses: Does serious damage on a variety of pitches, though there are still some concerns about the league being able to exploit his aggressiveness
Christian Walker: The power is real, but the discipline makes him an even tougher out. Also faced some of the toughest competition last year.
Lars Nootbaar: Second half breakout sure seems like it was legitimate.
And the breakout bats the model is skeptical of:
Michael A Harris: The 2022 NL Rookie of the Year still ranked in the top 70 percent of qualifying hitters last year but that’s not quite in the same ballpark as his 94th percentile wOBA.
Andres Gimenez: Gimenez was an all-star last year with the 34th-best wOBA in baseball. His HOBBS rank was almost 200 spots lower.
Jake Fraley: Somewhat quietly, Fraley had a .812 OPS a year ago for the Reds. HOBBS is far more skeptical that the components of his swing can produce that sort of output again.
Steven Kwan: The third-place finisher in the AL Rookie of the Year voting last year, Kwan may very well be an outlier whose elite plate discipline allows him to thrive.
Our subscribers make this reporting possible. Please consider supporting local journalism by subscribing to the Journal Sentinel at jsonline.com/deal.
DOWNLOAD THE APP: Get the latest news, sports and more
This article originally appeared on Milwaukee Journal Sentinel: Introducing HOBBS, a new way to evaluate MLB hitting performance

