How big is the rich-poor divide across the globe — and where do you fit in? New study provides answers
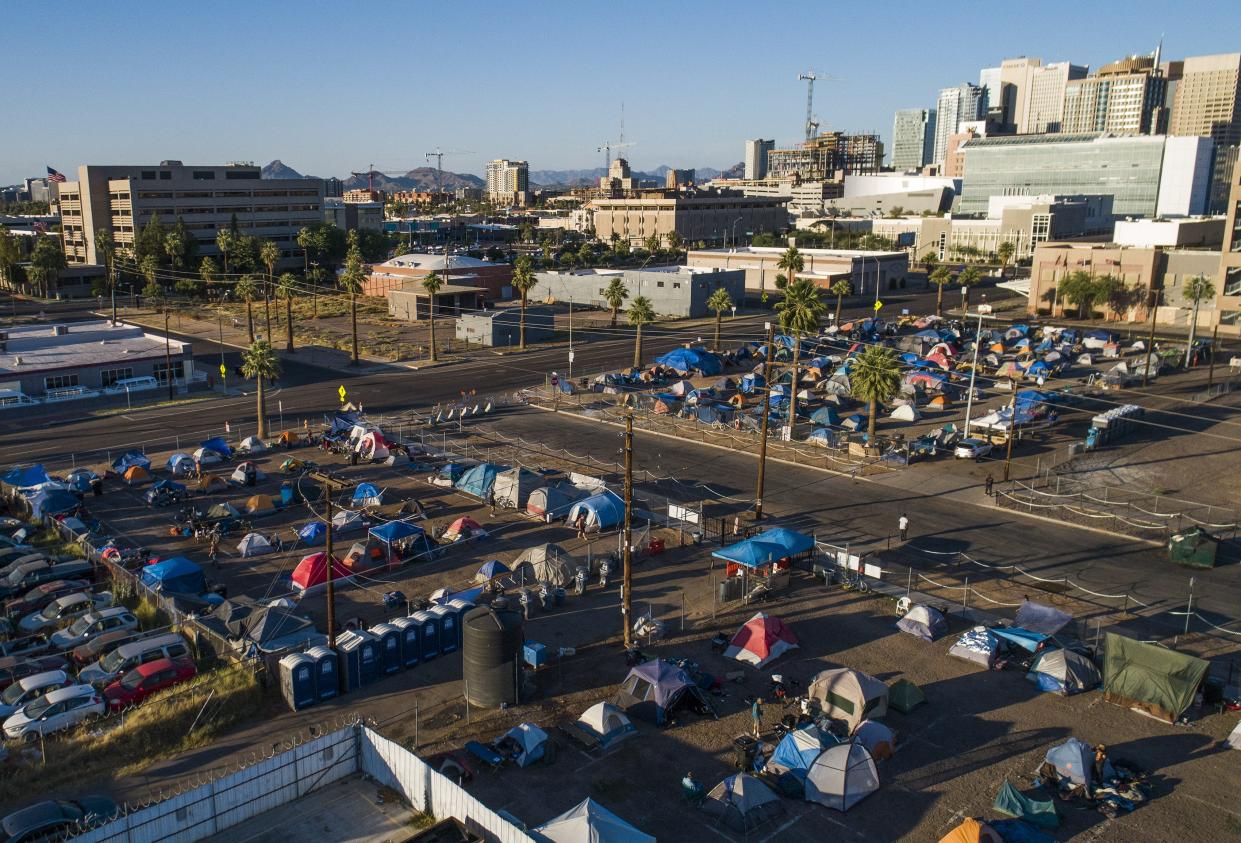
Thousands of people live in homeless camps in many large cities while billionaires board rocket ships for joyrides into space. Those are among the most vivid illustrations of the rich-poor divide, but there are others — and it's not just a problem in the United States.
A comprehensive new report attempts to provide greater clarity on the issue. Authors of the newly released World Inequality Database study claim it represents the "most up-to-date synthesis of international research efforts to track global inequalities." It's the work of more than 100 global researchers over four years, from Thomas Picketty of the Paris School of Economics to Emmanuel Saez of the University of California at Berkeley.
It's the second such report but the first since 2018. Here are some key insights:
How widespread is the rich-poor gap?
It’s a global phenomenon, the study contends, with the wealthiest 10% of the population earning about 52% of all income and owning between 60% and 80% of all assets, depending on the region. The poorest half of the global population earns about 8% of all income and collectively owns less than 5% of wealth.
In terms of dollars, someone in the global top 10% earns $122,000 a year on average, while a person in the poorest half makes around $3,900.
The Middle East/North Africa is the most unequal region, while Europe has relatively low levels of inequality. Of the 62 million people worldwide owning at least $1 million in net assets, 29 million reside in the U.S. or Canada. There are only 243,000 millionaires in sub-Sahara Africa, but wealth gaps are wide there, too.
Is inequality about income or wealth?
Both. The report addresses both income inequality, involving earnings mainly from employment, and inequality around net worth, or personal assets such as the value of homes, businesses and stock-market portfolios less mortgages and other debts.
Inequality is much greater in terms of wealth than income, as millions of poor people essentially live paycheck to paycheck, while more affluent individuals save up surplus earnings and use it to generate returns from investments.
"The poorest half of the global population barely owns any wealth at all, possessing just 2% of the total," the report said. "In contrast, the richest 10% of the global population own 76% of all wealth."
In terms of dollars, people in the lower half own about $4,100 in net assets on average, compared with $771,000 on average for those in the top 10%.
Has the gap narrowed, or widened?
In recent decades, rich-poor divides have widened. Since 1995, for example, the richest 1% of the global population captured 38% of the wealth created over that period, while the poorest half got 2%. The rest went to people in the middle.
This divide was exacerbated by the COVID-19 crisis in poorer nations but not in the U.S.
"In rich countries, social programs tempered the impact on inequality,” said Lucas Chancel, co-director of the World Inequality Lab, which produced the report. In wealthier nations, increased health care spending, stimulus payments and other cash transfers effectively contained poverty over the past two years, he said.
But this recent stabilization success might prove an anomaly, as global inequalities are still about as wide as they were more than a century ago. "The share of income presently captured by the poorest half of the world’s people is about half what it was in 1820, before the great divergence between Western countries and their colonies," the report said.
The researchers attribute widening rich-poor gaps to government policies that, they say, have largely favored the affluent.
"Income and wealth inequalities have been on the rise nearly everywhere since the 1980s, following a series of deregulation and liberalization programs which took different forms in different countries," according to the report.
How have demographic groups fared?
One of the key inequalities involves women who, according to the study, take in only 35% of work-related income on a global scale, with men accounting for the rest. Nor has this changed much over the past three decades. The U.S. situation is a bit more equal with 39% of labor income going to women.
Russia and other Central Asian countries have come closest to gender income parity, with women earning about 40% of what men make. The Middle East/North Africa region is by far the worst, with women there earning only about 15%.
Another subplot is that governments, ladened with borrowing, have become poorer over this stretch. "While private wealth has skyrocketed, public wealth has gone negative,” the report said. This situation constrains government efforts to address inequality and "raises important questions about who should repay public debt in the years to come.”
Is this just an economic issue?
One key assertion is that economic inequalities worsen climate change, with wealthier people generating much more pollution than poorer ones. The rich, for example, tend to travel more, spend more to heat and cool larger homes and eschew public transportation. The bottom half of the global population is responsible for just 12% of all carbon emissions, while people in the top 10% emit about half.
Perhaps the greatest sign of “emissions inequality" is the new trend of billionaires such as Jeff Bezos and Richard Branson rocketing into space.
"An 11-minute flight emits no fewer than 75 (metric) tonnes of carbon per passenger once indirect emissions are taken into account," the study said. "At the other end of the distribution, about one billion individuals emit less than one tonne per person per year ... . It therefore takes a few minutes in space travel to emit at least as much carbon as an individual from the bottom billion will emit in (his or her) entire lifetime."
What actions might narrow the gap?
Many countries recently agreed on a global minimum tax on corporations, and the researchers said they'd like to see the same applied to wealthy individuals. There also are efforts to better understand how and where the ultrawealthy transfer and park assets in offshore accounts, and efforts to tax investments in heavily polluting industries, with tax incentives to invest in clean sectors.
Chancel said the researchers back a global tax on millionaires — people owning assets worth $1 million or more — at rates that could range from 1% to 3% , or possibly higher.
"Progressive wealth taxes can actually be very good for growth and very good for prosperity for all, provided the revenues that are generated are well-invested in sectors that make sure that everybody accesses basic services," he said.
Some wealth taxes are already widespread, such as property taxes and those levied on estates. The researchers would like to see this extended to other types of wealth.
Yet these and other proposals remain highly contentious political issues.
How can I tell where I fit on this issue?
The study is at https://wir2022.wid.world or https://inequalitylab.world, which also features a calculator that lets you plug in your income and wealth totals (or hypothetical numbers). The calculator allows you to estimate how you, or someone else, would fit into the wealth and income spectrums of the U.S. or dozens of other nations.
As noted earlier, inequality can be measured either in terms of income or wealth/net worth. For example, affluent retirees might find themselves high up the wealth ladder but lower on the income spectrum. The results could flip for a highly paid professional who spends most of his or her salary.
Reach the reporter at russ.wiles@arizonarepublic.com.
Support local journalism. Subscribe to azcentral.com today.
This article originally appeared on Arizona Republic: World Inequality Database study tracks income and wealth disparities

