Is Big River Industries Limited's (ASX:BRI) High P/E Ratio A Problem For Investors?

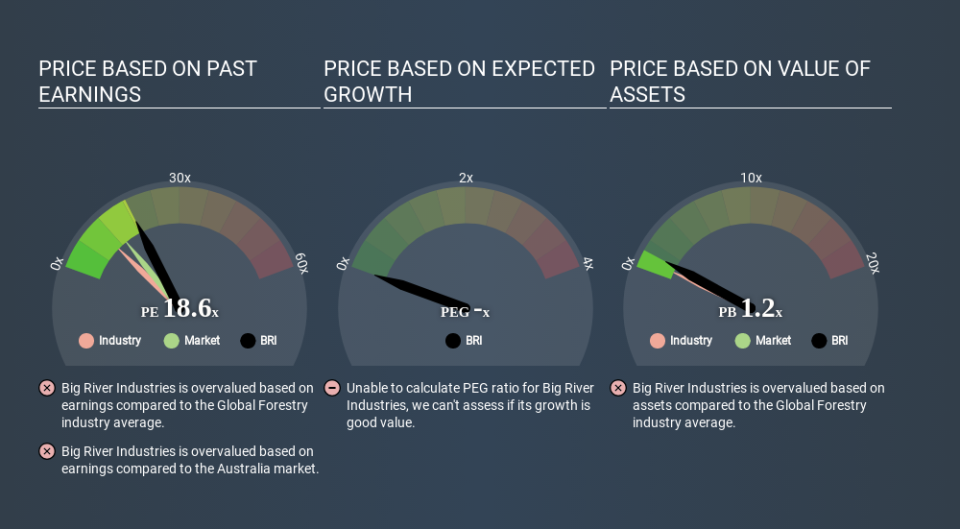
The goal of this article is to teach you how to use price to earnings ratios (P/E ratios). To keep it practical, we'll show how Big River Industries Limited's (ASX:BRI) P/E ratio could help you assess the value on offer. Based on the last twelve months, Big River Industries's P/E ratio is 18.60. That means that at current prices, buyers pay A$18.60 for every A$1 in trailing yearly profits.
Check out our latest analysis for Big River Industries
How Do You Calculate A P/E Ratio?
The formula for price to earnings is:
Price to Earnings Ratio = Price per Share ÷ Earnings per Share (EPS)
Or for Big River Industries:
P/E of 18.60 = A$1.390 ÷ A$0.075 (Based on the year to December 2019.)
(Note: the above calculation results may not be precise due to rounding.)
Is A High P/E Ratio Good?
The higher the P/E ratio, the higher the price tag of a business, relative to its trailing earnings. All else being equal, it's better to pay a low price -- but as Warren Buffett said, 'It's far better to buy a wonderful company at a fair price than a fair company at a wonderful price'.
How Does Big River Industries's P/E Ratio Compare To Its Peers?
The P/E ratio essentially measures market expectations of a company. The image below shows that Big River Industries has a higher P/E than the average (10.4) P/E for companies in the forestry industry.
Its relatively high P/E ratio indicates that Big River Industries shareholders think it will perform better than other companies in its industry classification. The market is optimistic about the future, but that doesn't guarantee future growth. So investors should always consider the P/E ratio alongside other factors, such as whether company directors have been buying shares.
How Growth Rates Impact P/E Ratios
Earnings growth rates have a big influence on P/E ratios. Earnings growth means that in the future the 'E' will be higher. And in that case, the P/E ratio itself will drop rather quickly. Then, a lower P/E should attract more buyers, pushing the share price up.
Big River Industries's earnings per share fell by 2.5% in the last twelve months.
A Limitation: P/E Ratios Ignore Debt and Cash In The Bank
Don't forget that the P/E ratio considers market capitalization. Thus, the metric does not reflect cash or debt held by the company. The exact same company would hypothetically deserve a higher P/E ratio if it had a strong balance sheet, than if it had a weak one with lots of debt, because a cashed up company can spend on growth.
Spending on growth might be good or bad a few years later, but the point is that the P/E ratio does not account for the option (or lack thereof).
Is Debt Impacting Big River Industries's P/E?
Net debt is 27% of Big River Industries's market cap. You'd want to be aware of this fact, but it doesn't bother us.
The Bottom Line On Big River Industries's P/E Ratio
Big River Industries's P/E is 18.6 which is above average (13.4) in its market. With a bit of debt, but a lack of recent growth, it's safe to say the market is expecting improved profit performance from the company, in the next few years.
Investors should be looking to buy stocks that the market is wrong about. As value investor Benjamin Graham famously said, 'In the short run, the market is a voting machine but in the long run, it is a weighing machine. So this free visualization of the analyst consensus on future earnings could help you make the right decision about whether to buy, sell, or hold.
You might be able to find a better buy than Big River Industries. If you want a selection of possible winners, check out this free list of interesting companies that trade on a P/E below 20 (but have proven they can grow earnings).
If you spot an error that warrants correction, please contact the editor at editorial-team@simplywallst.com. This article by Simply Wall St is general in nature. It does not constitute a recommendation to buy or sell any stock, and does not take account of your objectives, or your financial situation. Simply Wall St has no position in the stocks mentioned.
We aim to bring you long-term focused research analysis driven by fundamental data. Note that our analysis may not factor in the latest price-sensitive company announcements or qualitative material. Thank you for reading.
