Bitcoin Dominance (BTCD) Resumes Climb Toward 50%
The Bitcoin dominance rate (BTCD) has been increasing since bouncing on May 19, 2021.
It’s approaching a descending resistance line and a significant resistance area near 52%.
Long-term BTCD movement
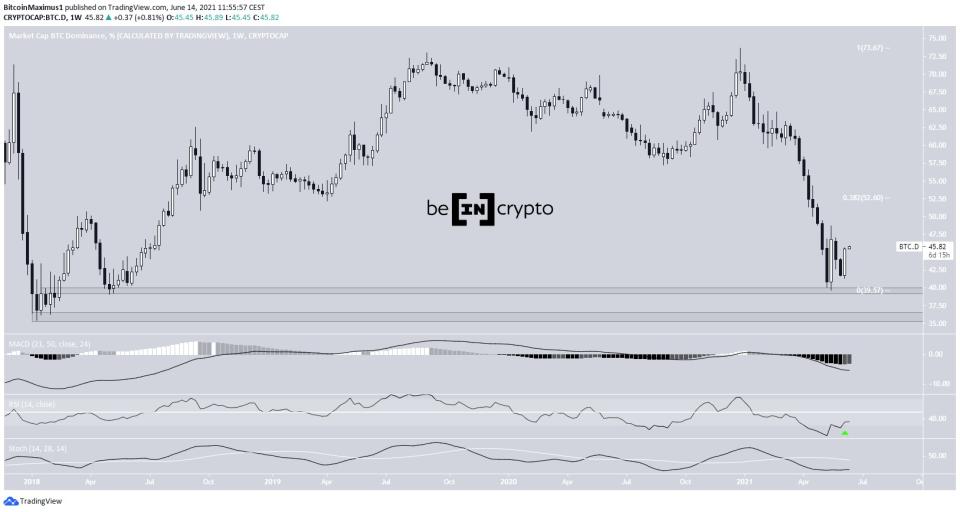
The bitcoin dominance rate has been decreasing since reaching a high of 73.63% in December 2020. So far, it has reached a low of 39.66% on May 19, 2021.
BTCD has bounced at the 39.50% support area and has reached a local high of 48.69%. The closest resistance area is found at 52.60%, created by the 0.382 Fib retracement resistance level.
On the other hand, the next support area is found at 36%.
Technical indicators are providing some bullish signs. The MACD has generated a higher momentum bar while the RSI has crossed above 30 (green icon). Furthermore, the Stochastic oscillator has halted its decrease and now has a neutral slope.
Therefore, while there are bullish reversal signs in place, a bullish reversal is not yet confirmed.
Cryptocurrency trader @Pentosh1 outlined a BTCD chart, which shows an upward movement towards 52%. As outlined above, this is the 0.382 Fib retracement resistance level.

Descending resistance
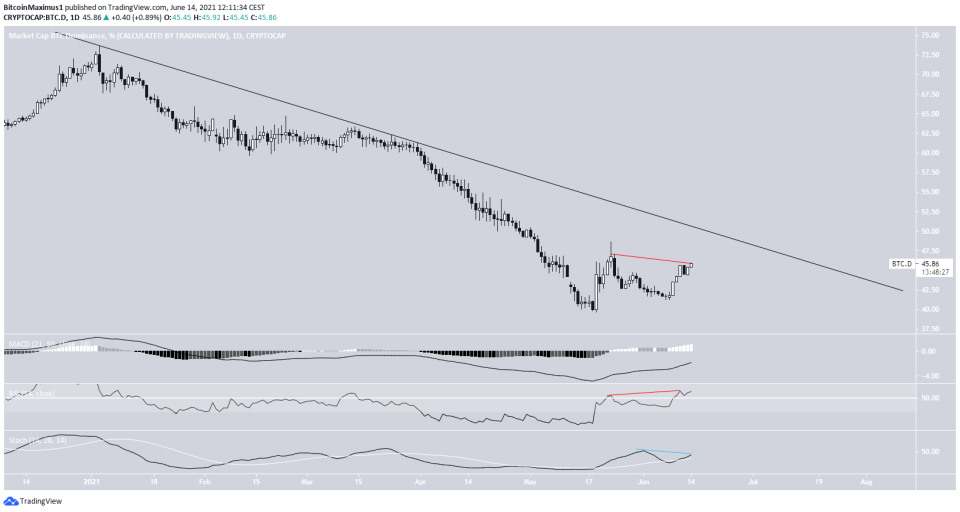
A look at the daily chart shows that the BTCD has been following a descending resistance line since January 2021. It was rejected by it on March 24, leading to the aforementioned low. The line is currently near 49%.
Technical indicators are mixed. The Stochastic oscillator has made a bullish cross, the RSI is above 50, and the MACD is increasing. All of these are bullish signs.
However, the Stochastic oscillator has also generated a bearish divergence (blue line). In addition, the RSI has generated a hidden bearish divergence (red line).
Therefore, similar to the weekly time frame, the daily chart is not sufficient to determine the direction of the trend.
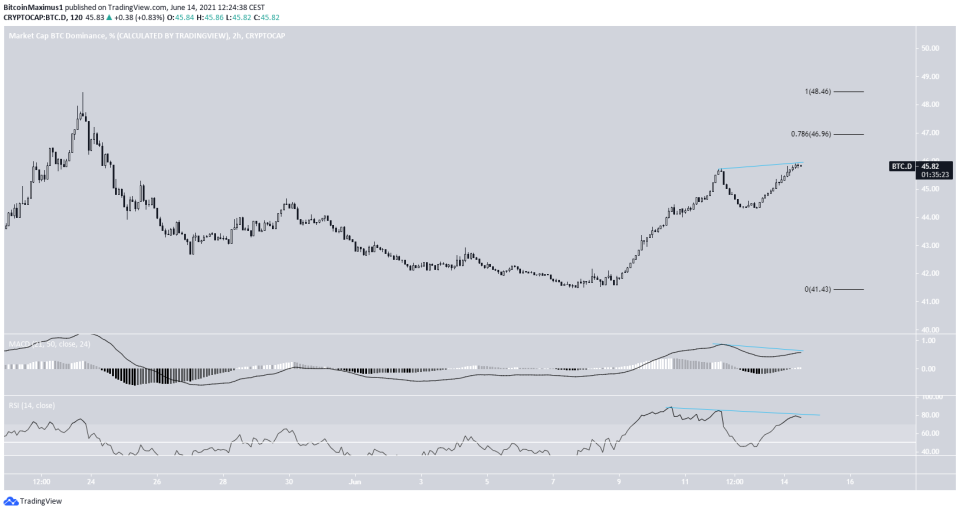
The two-hour chart shows clearer weaknesses.
Both the MACD and RSI have generated a bearish divergence and the BTCD is approaching resistance at 47%.
Therefore, a short-term rejection is expected.
BTCD wave count
The wave count suggests that the ongoing downward move is part of a bearish impulse (orange).
Currently, the BTCD is in wave four. A potential target for the bottom of the move is found at 27.80%. This would be a new all-time low.

The first part of the bounce (highlighted in green) looks like a three-wave structure. Therefore, it’s unlikely that this is the beginning of a new bearish impulse.
However, the second part of the upward move (green icon) looks impulsive.
This means that the pattern will most likely play out as an A-B-C corrective structure (black).
A potential target for the top would be at 50.55%. This would give waves A:C a 1:1 ratio, and would touch both the resistance line of a parallel ascending channel and the previously outlined descending resistance line.
Following this move, another decrease would be likely.

For BeInCrypto’s latest bitcoin (BTC) analysis, click here.

