Bitcoin Fear & Greed Index Signals More Bitcoin (BTC) Downside
Key Insights:
On Saturday, bitcoin (BTC) slipped by 0.12% to extend the losing streak to seven sessions.
It was a relatively range-bound session, with contagion from the 3AC bankruptcy filing pegging back the crypto market.
Technical indicators remain bearish, with bitcoin sitting below the 50-day EMA.
On Saturday, bitcoin (BTC) slipped by 0.12%. Following a 3.31% slide on Friday, bitcoin ended the day at $19,226.
A bearish start to the day saw bitcoin fall to a low of $18,895.
Finding buyer support at $19,000, bitcoin struck a high of $19,419 before easing back into the red.
The relatively range-bound session saw bitcoin leave the Major Support and Resistance Levels untested.
Significantly, however, bitcoin fell to sub-$19,000 for a third consecutive session.
With the US markets closed on Monday, investors will need to wait until Tuesday for direction from the NASDAQ 100 and US economic indicators.
Headwinds are unlikely to vanish any time soon. Fed monetary policy and fears of a recession remain market negatives.
Next week, economic indicators from the US to look out for will include ISM Non-Manufacturing PMI numbers and the all-important nonfarm payrolls.
Weak numbers would fuel market angst over the economic outlook. Upbeat figures would enable the Fed to stick to its aggressive rate path trajectory, both crypto negative.
Bitcoin Fear & Greed Index Continues to Send Bearish Signals
This morning, the Fear & Greed Index fell from 14/100 to 11/00. Bitcoin’s extended losing streak left the Index within recent ranges.
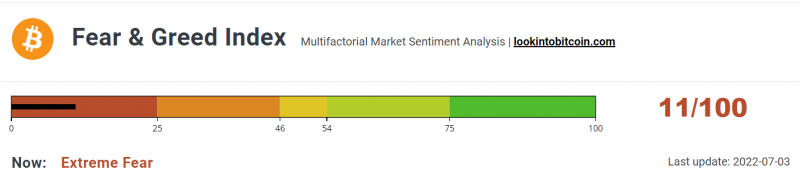
The Index last moved above 14/100 on June 8, when bitcoin stood at $30,229.
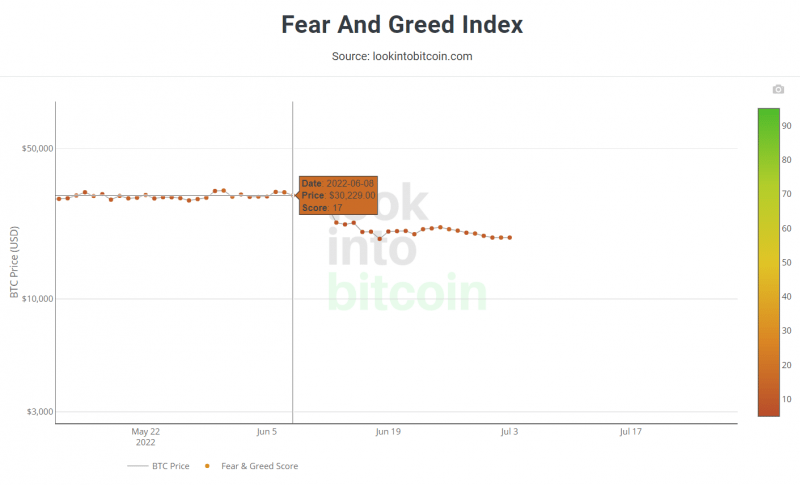
Failure to form an upward trend reflected crypto market conditions. The Index has moved within a tight range since falling into the “Extreme Fear” zone.
A move beyond 14/100 and an upward trend towards 25/100 would signal a shift in investor sentiment.
The Index last visited the “Fear Zone” on May 5, when BTC stood at $36,630.
Bitcoin (BTC) Price Action
At the time of writing, BTC was down 0.03% to $19,220.
A mixed start to the day saw BTC rise to a high of $19,266 before falling to a low of $19,158.
BTC left the Major Support and Resistance Levels untested early on.
Technical Indicators
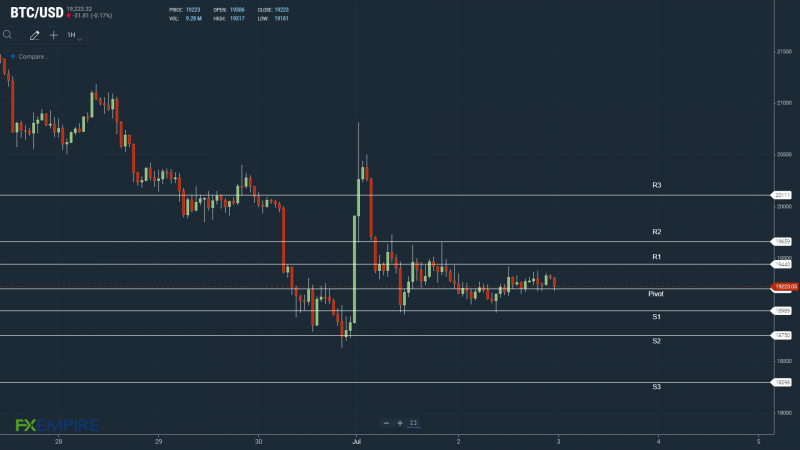
BTC will need to avoid the $19,201 pivot to test resistance at the Saturday high of $19,419 and the First Major Resistance Level at $19,440.
BTC would need broader market support for a return to $19,400.
An extended rally would test the Second Major Resistance Level at $19,659 and resistance at $20,000. The Third Major Resistance Level sits at $20,111.
A fall through the pivot would bring the First Major Support Level at $18,989 into play.
Barring another extended sell-off, BTC should avoid sub-$18,500. The Second Major Support Level at $18,750 should limit the downside.
The Third Major Support Level sits at $18,296.
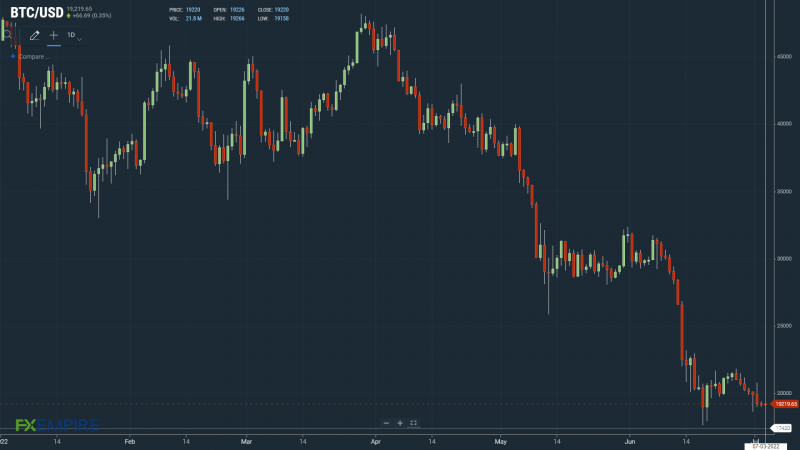
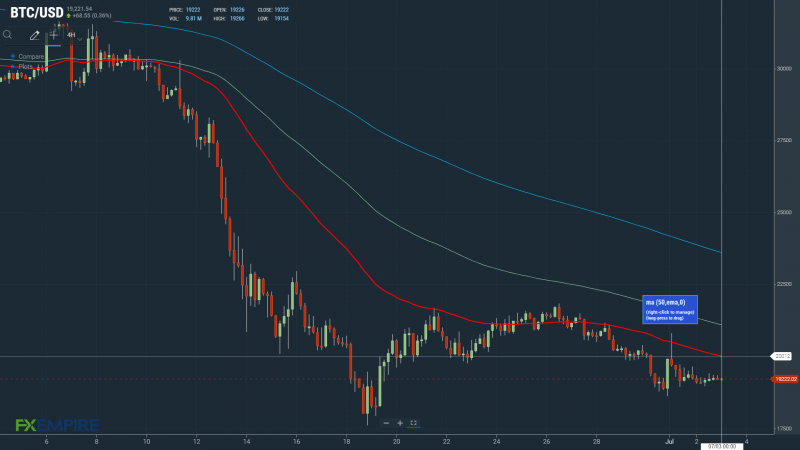
Looking at the EMAs and the 4-hourly candlestick chart (below), it was a bearish signal. This morning, bitcoin sat below the 50-day EMA, currently at $20,012.
The 50-day EMA fell back from the 100-day EMA. The 100-day EMA eased back from the 100-day EMA, bitcoin price negative.
A breakout from $19,500 would bring the 50-day EMA and the Third Major Resistance Level at $20,111 into play.
However, the Friday fall through the 50-day EMA does leave the Major Support Levels in play.
This article was originally posted on FX Empire
More From FXEMPIRE:
Ohio police officers shot fleeing Black man dozens of times, lawyer says
Hezbollah sends drones toward Israeli gas rig in disputed waters
Uzbekistan scraps plans to curb Karakalpak autonomy after protest
Argentina economy minister, IMF deal architect, quits as government crisis builds
At least 3 killed in blasts in Russia’s Belgorod near Ukraine – governor