BLS International Services Limited (NSE:BLS) Earns Among The Best Returns In Its Industry

Want to participate in a short research study? Help shape the future of investing tools and you could win a $250 gift card!
Today we'll look at BLS International Services Limited (NSE:BLS) and reflect on its potential as an investment. Specifically, we'll consider its Return On Capital Employed (ROCE), since that will give us an insight into how efficiently the business can generate profits from the capital it requires.
Firstly, we'll go over how we calculate ROCE. Then we'll compare its ROCE to similar companies. Finally, we'll look at how its current liabilities affect its ROCE.
Understanding Return On Capital Employed (ROCE)
ROCE measures the amount of pre-tax profits a company can generate from the capital employed in its business. In general, businesses with a higher ROCE are usually better quality. In brief, it is a useful tool, but it is not without drawbacks. Renowned investment researcher Michael Mauboussin has suggested that a high ROCE can indicate that 'one dollar invested in the company generates value of more than one dollar'.
So, How Do We Calculate ROCE?
The formula for calculating the return on capital employed is:
Return on Capital Employed = Earnings Before Interest and Tax (EBIT) ÷ (Total Assets - Current Liabilities)
Or for BLS International Services:
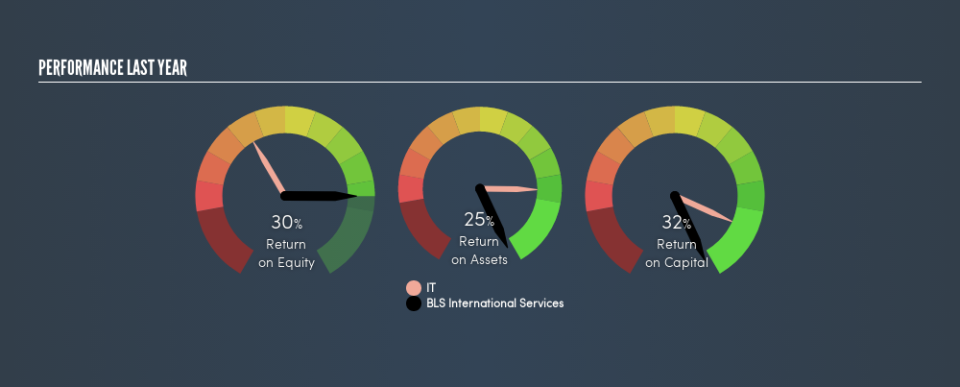
0.32 = ₹1.1b ÷ (₹4.7b - ₹1.1b) (Based on the trailing twelve months to December 2018.)
So, BLS International Services has an ROCE of 32%.
View our latest analysis for BLS International Services
Is BLS International Services's ROCE Good?
ROCE is commonly used for comparing the performance of similar businesses. BLS International Services's ROCE appears to be substantially greater than the 15% average in the IT industry. We consider this a positive sign, because it suggests it uses capital more efficiently than similar companies. Putting aside its position relative to its industry for now, in absolute terms, BLS International Services's ROCE is currently very good.
Remember that this metric is backwards looking - it shows what has happened in the past, and does not accurately predict the future. ROCE can be misleading for companies in cyclical industries, with returns looking impressive during the boom times, but very weak during the busts. ROCE is only a point-in-time measure. You can check if BLS International Services has cyclical profits by looking at this free graph of past earnings, revenue and cash flow.
What Are Current Liabilities, And How Do They Affect BLS International Services's ROCE?
Current liabilities include invoices, such as supplier payments, short-term debt, or a tax bill, that need to be paid within 12 months. Due to the way ROCE is calculated, a high level of current liabilities makes a company look as though it has less capital employed, and thus can (sometimes unfairly) boost the ROCE. To counter this, investors can check if a company has high current liabilities relative to total assets.
BLS International Services has total liabilities of ₹1.1b and total assets of ₹4.7b. As a result, its current liabilities are equal to approximately 23% of its total assets. The fairly low level of current liabilities won't have much impact on the already great ROCE.
What We Can Learn From BLS International Services's ROCE
This is good to see, and with such a high ROCE, BLS International Services may be worth a closer look. There might be better investments than BLS International Services out there, but you will have to work hard to find them . These promising businesses with rapidly growing earnings might be right up your alley.
If you are like me, then you will not want to miss this free list of growing companies that insiders are buying.
We aim to bring you long-term focused research analysis driven by fundamental data. Note that our analysis may not factor in the latest price-sensitive company announcements or qualitative material.
If you spot an error that warrants correction, please contact the editor at editorial-team@simplywallst.com. This article by Simply Wall St is general in nature. It does not constitute a recommendation to buy or sell any stock, and does not take account of your objectives, or your financial situation. Simply Wall St has no position in the stocks mentioned. Thank you for reading.

