BNB, 1INCH & CAKE Fail to Sustain Upward Movements
Binance Coin (BNB) is trading above long-term support at $320 and following a short-term descending resistance line.
1inch (1INCH) has broken down from an ascending support line and reached the $2.25 support area.
Pancake Swap (CAKE) is trading inside a short-term descending wedge.
BNB
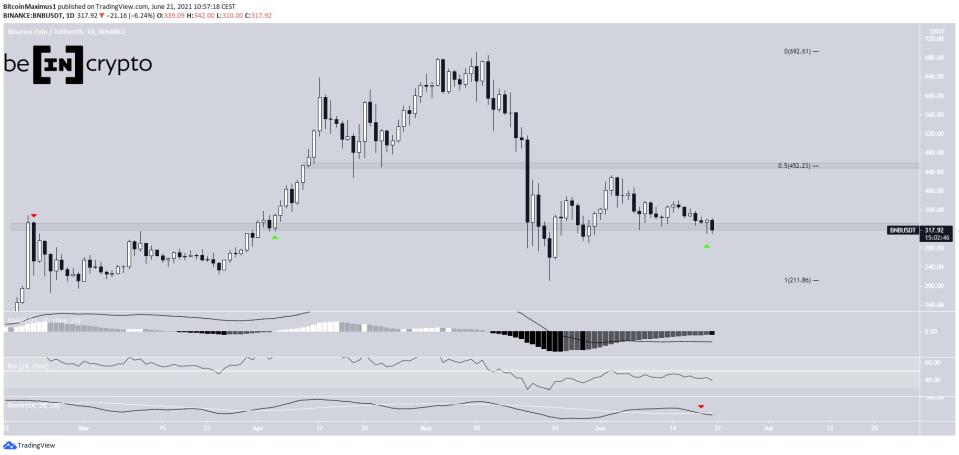
BNB dropped soon after it reached an all-time high price of $691.7 on May 10. It continued the downward movement until May 23, when a low of $211.70 was reached. This initiated a strong bounce, leading to a high of $433 on June 3.
However, BNB has been moving downwards since.
It has currently returned to the $320 area, a level which has previously acted as support. Whether it bounces or breaks down from it will likely determine the direction of the future trend.
A breakdown would take it back towards $200 while a bounce would take it towards the closest resistance at $450.
Technical indicators are bearish, supporting the possibility that a breakdown will eventually occur. This is especially evident by the bearish cross in the Stochastic oscillator and the RSI rejection from the 50 line.
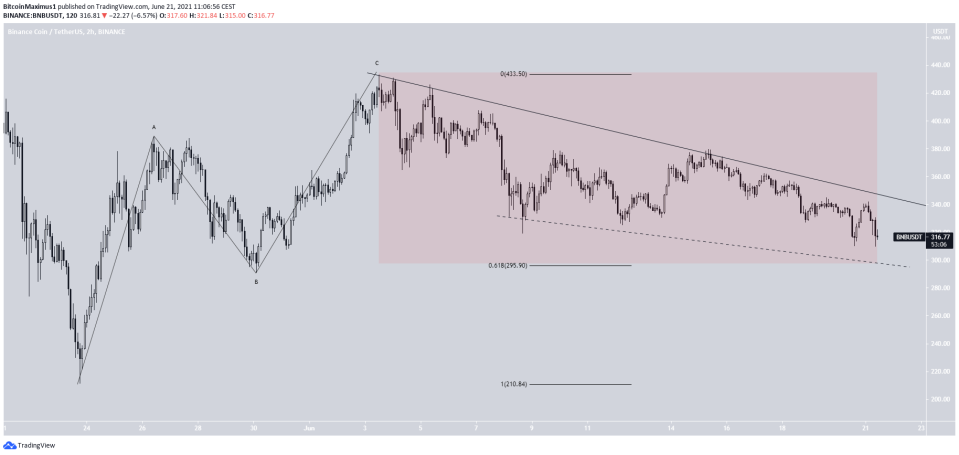
The shorter-term two-hour chart shows that BNB is following a descending resistance line since June 3 and is potentially trading inside a descending wedge. The support line of the wedge (dashed) has not been validated sufficient times as to be confirmed.
The bounce from the May 23 lows looks like a corrective A-B-C structure. However, the ensuing decrease also looks corrective.
Therefore, the most likely scenario would have BNB bouncing and breaking out in the short-term. It could do so after reaching the 0.618 Fib retracement support level at $296.
Despite this, it is likely that the long-term trend is bearish, and another decrease will eventually follow.
Highlights
There is support and resistance at $320 and $450.
BNB is following a short-term descending resistance line.
1INCH
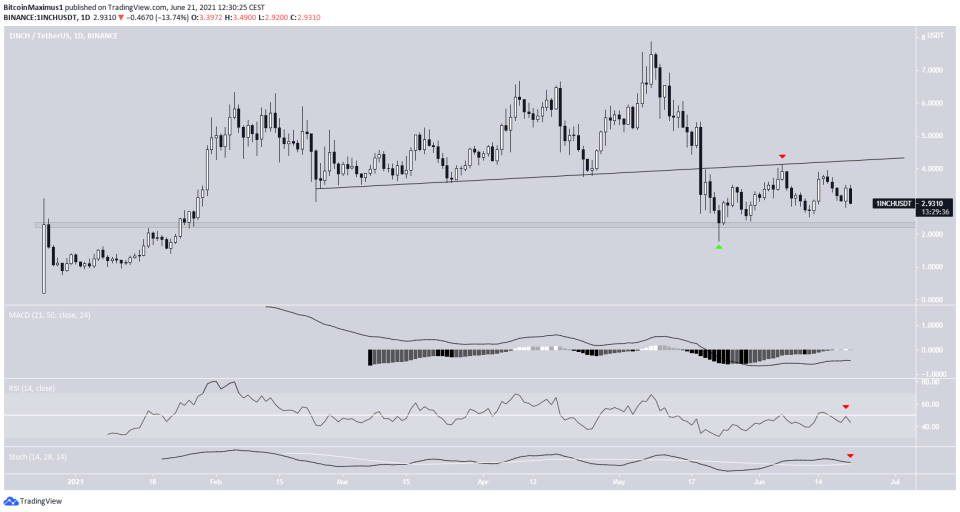
1INCH has been falling since May 8, when it reached an all-time high price of $7.97. It broke down from an ascending support line on May 19 and validated it as resistance on June 6 (green and red icons).
On May 23, the token reached a low of $1.77. The immediate bounce reclaimed the $2.25 area, validating it as support. However, the upward movement could not be sustained and 1INCH is in the process of falling towards the $2.25 area once more.
Technical indicators have turned bearish. The RSI has fallen below the 50 line and the Stochastic oscillator has made a bearish cross.
The daily candlestick is shaping up to be a bearish engulfing one. Therefore, another revisit of the $2.25 area seems likely.
Highlights
1INCH has broken down from an ascending support line.
There is horizontal support at $2.25.
CAKE
CAKE has been increasing since May 23, when it reached a low of $9.44. The immediate bounce served to validate the $9.80 area as support.
However, the ensuing upward movement was a three wave structure (highlighted in red), indicating that the bounce was corrective.
CAKE has been falling since June 3. The decrease has taken the shape of a descending wedge, which is considered a bullish reversal pattern.
Therefore, it is likely that the token finds short-term support and breaks out. It is currently right at the 0.618 Fib retracement support level.
Nevertheless, due to the lack of a bullish impulse, it is also likely that the longer-term trend is bearish.

Highlights
There is support at $9.80.
CAKE is trading inside a descending wedge.
For BeInCrypto’s latest bitcoin (BTC) analysis, click here.
