Boasting A 22% Return On Equity, Is RTC Group plc (LON:RTC) A Top Quality Stock?

Many investors are still learning about the various metrics that can be useful when analysing a stock. This article is for those who would like to learn about Return On Equity (ROE). To keep the lesson grounded in practicality, we'll use ROE to better understand RTC Group plc (LON:RTC).
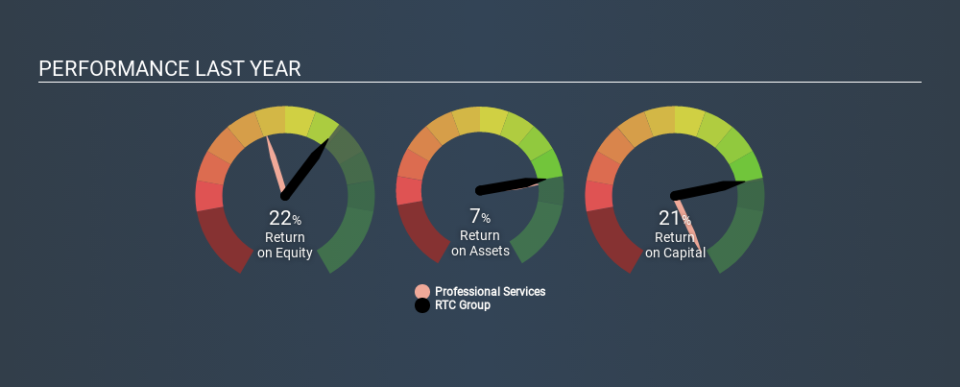
Over the last twelve months RTC Group has recorded a ROE of 22%. Another way to think of that is that for every £1 worth of equity in the company, it was able to earn £0.22.
View our latest analysis for RTC Group
How Do You Calculate ROE?
The formula for ROE is:
Return on Equity = Net Profit (from continuing operations) ÷ Shareholders' Equity
Or for RTC Group:
22% = UK£1.4m ÷ UK£6.2m (Based on the trailing twelve months to December 2019.)
Most know that net profit is the total earnings after all expenses, but the concept of shareholders' equity is a little more complicated. It is all the money paid into the company from shareholders, plus any earnings retained. Shareholders' equity can be calculated by subtracting the total liabilities of the company from the total assets of the company.
What Does Return On Equity Mean?
Return on Equity measures a company's profitability against the profit it has kept for the business (plus any capital injections). The 'return' is the yearly profit. A higher profit will lead to a higher ROE. So, all else being equal, a high ROE is better than a low one. That means ROE can be used to compare two businesses.
Does RTC Group Have A Good Return On Equity?
By comparing a company's ROE with its industry average, we can get a quick measure of how good it is. The limitation of this approach is that some companies are quite different from others, even within the same industry classification. As is clear from the image below, RTC Group has a better ROE than the average (13%) in the Professional Services industry.
That is a good sign. I usually take a closer look when a company has a better ROE than industry peers. For example, I often check if insiders have been buying shares.
How Does Debt Impact ROE?
Companies usually need to invest money to grow their profits. The cash for investment can come from prior year profits (retained earnings), issuing new shares, or borrowing. In the first and second cases, the ROE will reflect this use of cash for investment in the business. In the latter case, the debt required for growth will boost returns, but will not impact the shareholders' equity. In this manner the use of debt will boost ROE, even though the core economics of the business stay the same.
Combining RTC Group's Debt And Its 22% Return On Equity
RTC Group has a debt to equity ratio of 0.57, which is far from excessive. When I see a high ROE, fuelled by only modest debt, I suspect the business is high quality. Conservative use of debt to boost returns is usually a good move for shareholders, though it does leave the company more exposed to interest rate rises.
But It's Just One Metric
Return on equity is a useful indicator of the ability of a business to generate profits and return them to shareholders. A company that can achieve a high return on equity without debt could be considered a high quality business. If two companies have around the same level of debt to equity, and one has a higher ROE, I'd generally prefer the one with higher ROE.
But when a business is high quality, the market often bids it up to a price that reflects this. Profit growth rates, versus the expectations reflected in the price of the stock, are a particularly important to consider. Check the past profit growth by RTC Group by looking at this visualization of past earnings, revenue and cash flow.
Of course RTC Group may not be the best stock to buy. So you may wish to see this free collection of other companies that have high ROE and low debt.
If you spot an error that warrants correction, please contact the editor at editorial-team@simplywallst.com. This article by Simply Wall St is general in nature. It does not constitute a recommendation to buy or sell any stock, and does not take account of your objectives, or your financial situation. Simply Wall St has no position in the stocks mentioned.
We aim to bring you long-term focused research analysis driven by fundamental data. Note that our analysis may not factor in the latest price-sensitive company announcements or qualitative material. Thank you for reading.
