Is boohoo group plc's (LON:BOO) Liquidity Good Enough?

Small-cap and large-cap companies receive a lot of attention from investors, but mid-cap stocks like boohoo group plc (LON:BOO), with a market cap of UK£2.7b, are often out of the spotlight. Despite this, commonly overlooked mid-caps have historically produced better risk-adjusted returns than their small and large-cap counterparts. Today we will look at BOO’s financial liquidity and debt levels, which are strong indicators for whether the company can weather economic downturns or fund strategic acquisitions for future growth. Note that this commentary is very high-level and solely focused on financial health, so I suggest you dig deeper yourself into BOO here.
Want to participate in a short research study? Help shape the future of investing tools and you could win a $250 gift card!
View our latest analysis for boohoo group
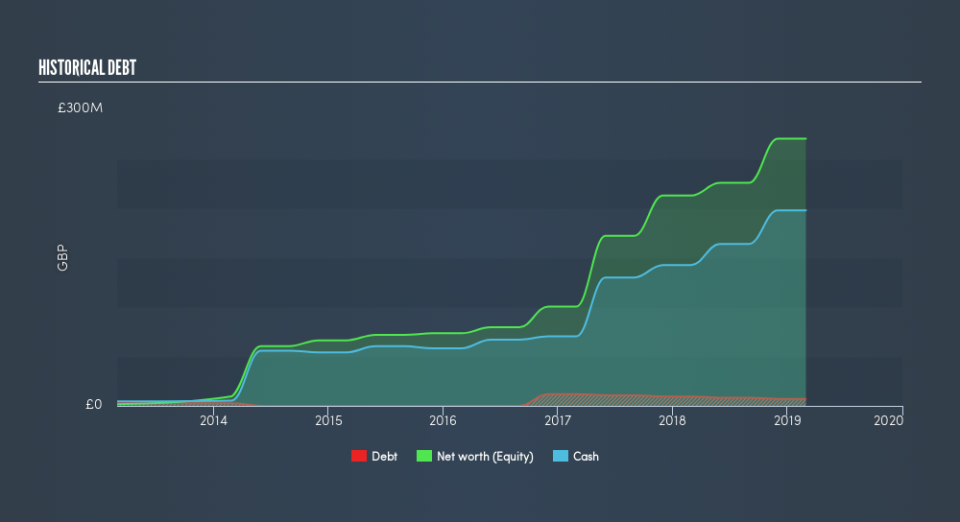
BOO’s Debt (And Cash Flows)
Over the past year, BOO has reduced its debt from UK£9.5m to UK£7.1m , which includes long-term debt. With this reduction in debt, the current cash and short-term investment levels stands at UK£198m to keep the business going. On top of this, BOO has produced UK£102m in operating cash flow during the same period of time, resulting in an operating cash to total debt ratio of 1421%, indicating that BOO’s debt is appropriately covered by operating cash.
Can BOO meet its short-term obligations with the cash in hand?
Looking at BOO’s UK£162m in current liabilities, it appears that the company has been able to meet these commitments with a current assets level of UK£296m, leading to a 1.83x current account ratio. The current ratio is calculated by dividing current assets by current liabilities. For Online Retail companies, this ratio is within a sensible range since there is a bit of a cash buffer without leaving too much capital in a low-return environment.
Does BOO face the risk of succumbing to its debt-load?
With debt at 2.6% of equity, BOO may be thought of as having low leverage. This range is considered safe as BOO is not taking on too much debt obligation, which can be restrictive and risky for equity-holders.
Next Steps:
BOO’s high cash coverage and low debt levels indicate its ability to utilise its borrowings efficiently in order to generate ample cash flow. Furthermore, the company exhibits proper management of current assets and upcoming liabilities. This is only a rough assessment of financial health, and I'm sure BOO has company-specific issues impacting its capital structure decisions. I suggest you continue to research boohoo group to get a better picture of the stock by looking at:
Future Outlook: What are well-informed industry analysts predicting for BOO’s future growth? Take a look at our free research report of analyst consensus for BOO’s outlook.
Valuation: What is BOO worth today? Is the stock undervalued, even when its growth outlook is factored into its intrinsic value? The intrinsic value infographic in our free research report helps visualize whether BOO is currently mispriced by the market.
Other High-Performing Stocks: Are there other stocks that provide better prospects with proven track records? Explore our free list of these great stocks here.
We aim to bring you long-term focused research analysis driven by fundamental data. Note that our analysis may not factor in the latest price-sensitive company announcements or qualitative material.
If you spot an error that warrants correction, please contact the editor at editorial-team@simplywallst.com. This article by Simply Wall St is general in nature. It does not constitute a recommendation to buy or sell any stock, and does not take account of your objectives, or your financial situation. Simply Wall St has no position in the stocks mentioned. Thank you for reading.
