Do Bouygues SA’s (EPA:EN) Returns On Capital Employed Make The Cut?

Today we'll look at Bouygues SA (EPA:EN) and reflect on its potential as an investment. Specifically, we're going to calculate its Return On Capital Employed (ROCE), in the hopes of getting some insight into the business.
First, we'll go over how we calculate ROCE. Next, we'll compare it to others in its industry. And finally, we'll look at how its current liabilities are impacting its ROCE.
Return On Capital Employed (ROCE): What is it?
ROCE measures the 'return' (pre-tax profit) a company generates from capital employed in its business. Generally speaking a higher ROCE is better. Ultimately, it is a useful but imperfect metric. Renowned investment researcher Michael Mauboussin has suggested that a high ROCE can indicate that 'one dollar invested in the company generates value of more than one dollar'.
How Do You Calculate Return On Capital Employed?
The formula for calculating the return on capital employed is:
Return on Capital Employed = Earnings Before Interest and Tax (EBIT) ÷ (Total Assets - Current Liabilities)
Or for Bouygues:
0.082 = €1.7b ÷ (€40b - €20b) (Based on the trailing twelve months to June 2019.)
So, Bouygues has an ROCE of 8.2%.
Check out our latest analysis for Bouygues
Does Bouygues Have A Good ROCE?
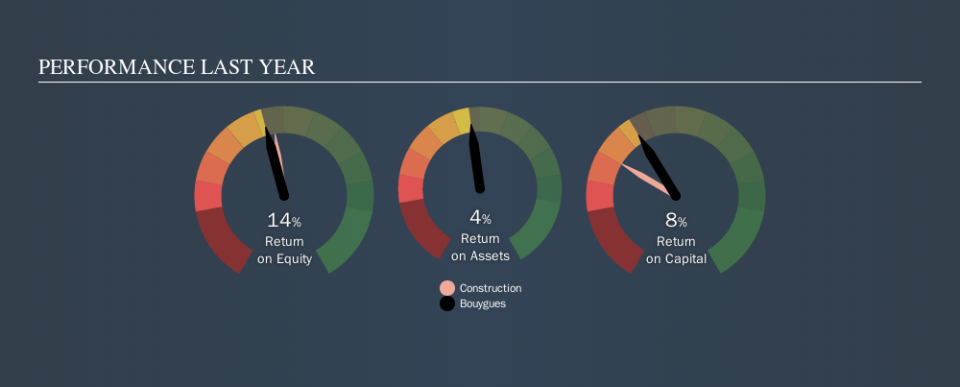
ROCE is commonly used for comparing the performance of similar businesses. It appears that Bouygues's ROCE is fairly close to the Construction industry average of 8.9%. Setting aside the industry comparison for now, Bouygues's ROCE is mediocre in absolute terms, considering the risk of investing in stocks versus the safety of a bank account. It is possible that there are more rewarding investments out there.
Our data shows that Bouygues currently has an ROCE of 8.2%, compared to its ROCE of 4.9% 3 years ago. This makes us think about whether the company has been reinvesting shrewdly. You can click on the image below to see (in greater detail) how Bouygues's past growth compares to other companies.
It is important to remember that ROCE shows past performance, and is not necessarily predictive. ROCE can be misleading for companies in cyclical industries, with returns looking impressive during the boom times, but very weak during the busts. ROCE is, after all, simply a snap shot of a single year. Future performance is what matters, and you can see analyst predictions in our free report on analyst forecasts for the company.
What Are Current Liabilities, And How Do They Affect Bouygues's ROCE?
Current liabilities include invoices, such as supplier payments, short-term debt, or a tax bill, that need to be paid within 12 months. Due to the way ROCE is calculated, a high level of current liabilities makes a company look as though it has less capital employed, and thus can (sometimes unfairly) boost the ROCE. To counter this, investors can check if a company has high current liabilities relative to total assets.
Bouygues has total liabilities of €20b and total assets of €40b. As a result, its current liabilities are equal to approximately 49% of its total assets. Bouygues has a medium level of current liabilities, which would boost its ROCE somewhat.
The Bottom Line On Bouygues's ROCE
With this level of liabilities and a mediocre ROCE, there are potentially better investments out there. You might be able to find a better investment than Bouygues. If you want a selection of possible winners, check out this free list of interesting companies that trade on a P/E below 20 (but have proven they can grow earnings).
If you are like me, then you will not want to miss this free list of growing companies that insiders are buying.
We aim to bring you long-term focused research analysis driven by fundamental data. Note that our analysis may not factor in the latest price-sensitive company announcements or qualitative material.
If you spot an error that warrants correction, please contact the editor at editorial-team@simplywallst.com. This article by Simply Wall St is general in nature. It does not constitute a recommendation to buy or sell any stock, and does not take account of your objectives, or your financial situation. Simply Wall St has no position in the stocks mentioned. Thank you for reading.
