The last three midterms in Knox County show blue creeping in. Check out the maps
- Oops!Something went wrong.Please try again later.
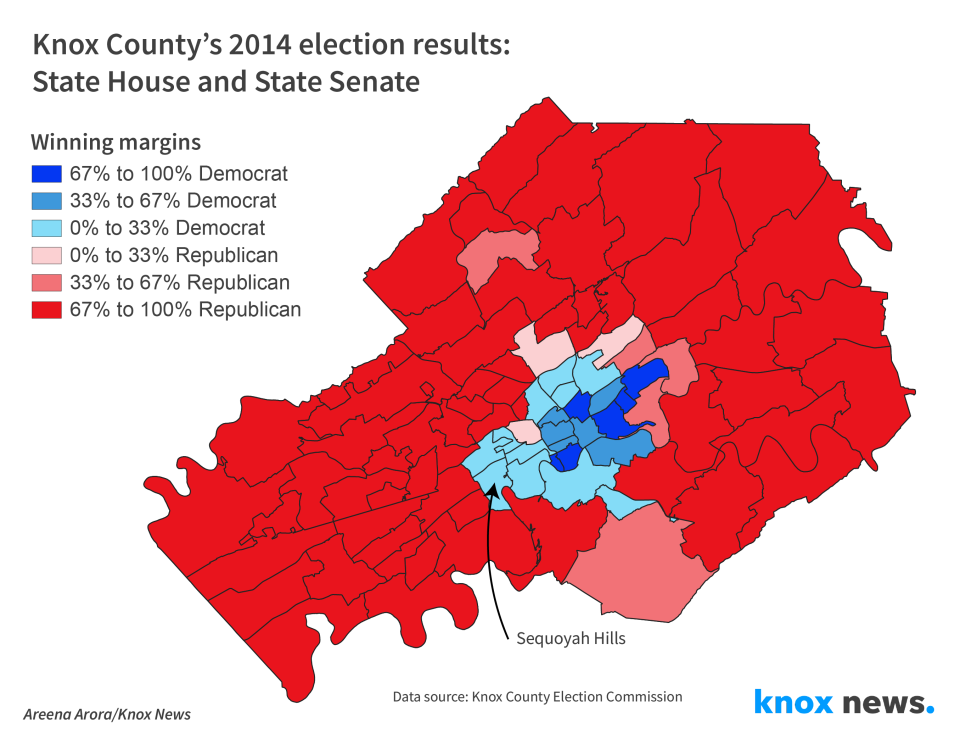
The 2014 midterms were the first glimpse of things to come for Knox County.
Take one race as an example. After her first term in office, Democratic state Rep. Gloria Johnson ran for reelection but lost to Republican Eddie Smith in the first of three razor-thin matchups between the two.
In that 2014 race, Johnson surprisingly bested Smith in Knoxville's wealthy Sequoyah Hills precinct with 50.8% of the vote ‒ the only Democrat to win the precinct in that election.
The 2014 election results map shades the Sequoyah Hills neighborhood blue because the map here shows Tennessee's House and Senate races. But when you look at the complete ballot, Republicans, represented on maps by red, did much better in Sequoyah Hills that year: Gov. Bill Haslam got 75% of the vote, U.S. Sen. Lamar Alexander got 58% and U.S. Rep. John J. "Jimmy" Duncan got 62%.
But nonetheless, bigger changes were ahead for the historically conservative-leaning neighborhood close to downtown that's home to corporate executives and community leaders.
The political landscape changed fast after 2014. Two years later, in 2016, the precinct slightly favored Democrat Hillary Clinton (51%) for president even as it stuck with Republicans Duncan (60.5%) and Smith (50.6%).
It hasn’t swung for any Republican since.
Knox News mapped data from state House and Senate races from the past three midterm elections – 2014, 2018 and 2022 – and the pattern is clear: the Democratic Party is growing stronger in Knox County. The hardline Republican vote is softening.
Some areas, like Sequoyah Hills, aren’t likely to go back.
Republicans still win countywide, and that likely will continue for the foreseeable future. But, on the whole, the county is changing.
Here are some takeaways from the data we collected:
It started in 2016 with Donald Trump
Looking at the 2014 election map is like looking back to a different time. The city of Knoxville, the center of Knox County, is blue as ever but it is surrounded by deep, deep red representing rock-solid Republican voters.
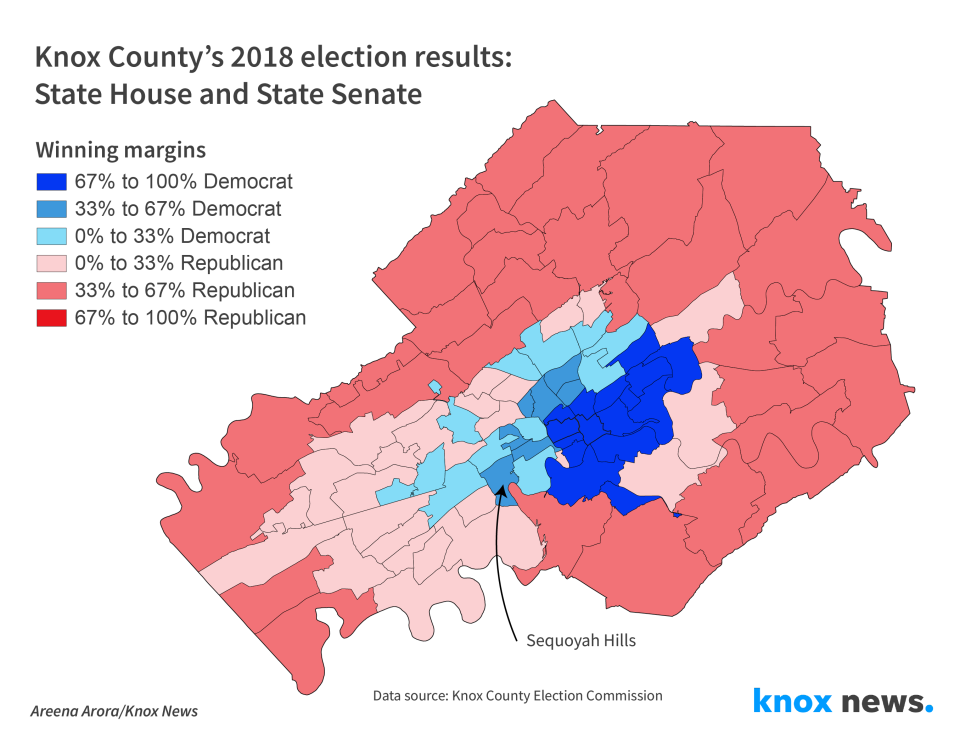
Four years later – and two years after Donald Trump was elected president – the map remains dominated by Republicans but the deep red edges have softened: every precinct moved slightly to the left politically and some, in and around the city limits, expanded blue.
It goes beyond the state house races shown on our maps. While Trump won 58.5% of Knox County in 2016, he dropped to 56.4% in 2020. The Democratic ticket, meanwhile, went in the opposite direction, from 34.8% for Hillary Clinton to 41.5% for Joe Biden.
Likewise, support for conservative Knox County Mayor Glenn Jacobs has shifted. In 2018 he steamrolled on his way into the job with 66% of the vote. Four years later his support dropped double digits to to 55% of voters. It was still plenty to win the reelection but follows a trend for the county.
West Knoxville is now blue
The new Tennessee House districts drawn by Republican lawmakers in the once-a-decade redistricting process completed at the state level in 2021 and the local level in 2022 were expected to damage Democrats' ability to win seats, but the expectations failed to materialize here. Johnson's District 13 was combined with another, forcing her to move to run in the newly created District 90.
The far reaches of her new district include parts of West Knoxville such as the Cedar Bluff precinct, which was solidly red in 2014 when it was held by State Rep. Martin Daniel. It's now blue – Johnson won the precinct with 54%.
Even neighborhoods that aren't solidly Democratic are significantly less Republican than they were in 2014.
Election results:GOP redrew district lines but it didn't matter in Knox County: What the midterms showed us
Change inches along outside the city
The city of Knoxville has been home to many Democrats for years. Data shows this has intensified over the past decade – particularly in West Knoxville – and it’s likely to continue.
Changes in the outlying county, though, move slower.
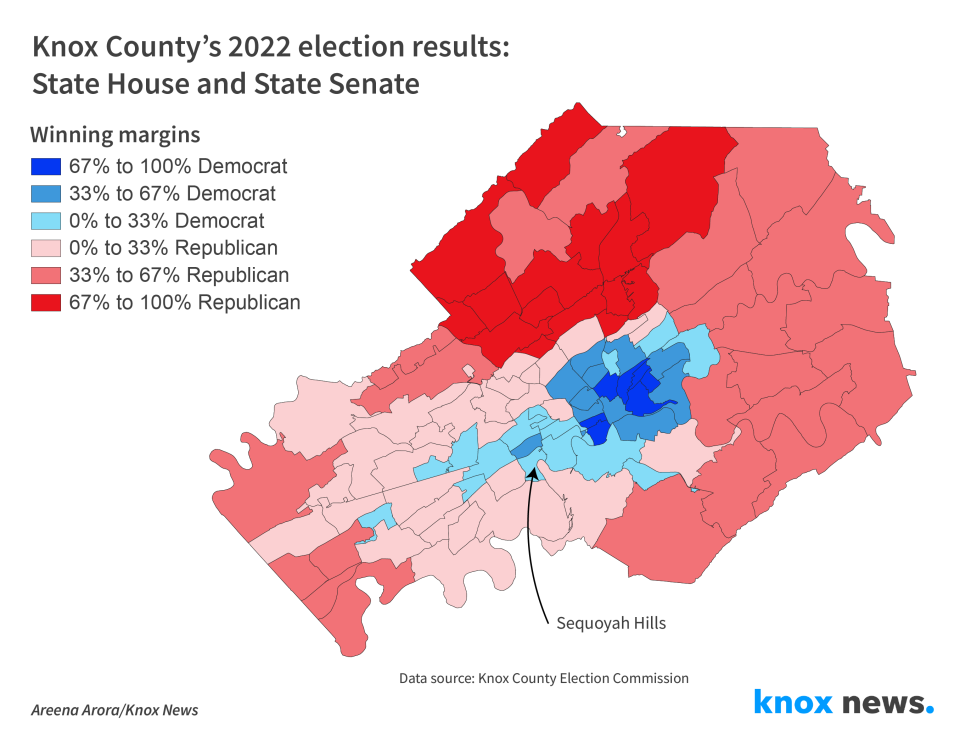
Precincts such as the one where voters cast their ballots at Solway Church of God in far West Knox County remains a heavy Republican area. Gov. Lee got 64.5% of the vote in Solway, for instance, but the figure has dropped since 2014 when Haslam got 81.5% and Alexander got 70.5%.
The only places in the county that remain statistically as Republican as they did in 2014 are all north, in neighborhoods like Powell and Halls.
Much of Knoxville’s edges remain toss ups
For all the ground gained by Democrats in places Pleasant Ridge, it remains a competitive precinct for both parties. In 2018 it went for Democrat Greg Mackay in the District 18 House race but leaned red in 2014 and again this fall.
A few precincts swing back and forth.
Even with the changing voting patterns, Democrats have a long way to go to consistently challenge Republicans in Knox County and GOP-controlled redistricting made the uphill fight even harder.
Democrats figured they had a chance at picking up a seat this fall in the newly redrawn District 18, which previously included mostly West Knoxville but was redrawn to pick up conservative parts of South Knoxville. Republican Elaine Davis dashed any hopes of a Democratic win, easily knocking off Gregory Kaplan, 54% to 46%.
There are important outliers
U.S. Rep. Tim Burchett, a folksy Republican with a long history as an elected leader in East Tennessee, has run three times for Congress and has secured nearly identical totals in Knox County every time – 60.1%, 61.3% and 60.7%.
Gov. Lee even improved on his 2018 total, going from 57.6% to 59.3%.
Areena Arora is a data and investigative reporter. You can reach her at areena.arora@knoxnews.com, and follow her on Twitter @AreenaArora. Support our newsroom's exclusive, in-depth local coverage by subscribing at knoxnews.com/subscribe.
Tyler Whetstone is an investigative reporter focused on accountability journalism. Connect with Tyler by emailing him at tyler.whetstone@knoxnews.com. Follow him on Twitter @tyler_whetstone. Make our community, our society and our republic stronger by supporting robust local journalism. Subscribe online at knoxnews.com/subscribe.
This article originally appeared on Knoxville News Sentinel: Election maps show Knox County is turning bluer, year by year

