Why this 10-year-old bull market is actually a one-year-old: Morning Brief
Friday, December 27, 2019
Get the Morning Brief sent directly to your inbox every Monday to Friday by 6:30 a.m. ET. Subscribe
Overthinking the math
According to people who uncompromisingly follow rules to the T, the S&P 500 (^GSPC) hasn’t experienced a bear market since the financial crisis.
The market has seen plenty of 10%+ “corrections” since it bottomed in March 2009, on its way to setting new record highs at Thursday’s close. But if you’re referencing the market based on closing prices, the S&P has yet to fall into a bear market, which is traditionally defined as a 20% decline from a high closing price to a low closing price. (A year ago, the S&P barely missed it, falling 19.8% from its Sept. 20 closing high 2,930.75 to its Dec. 24 closing low of 2,351.10.)
That said, if you look at intraday prices, the story changes. The S&P fell 20.0% from its Sept. 21, 2018 intraday high of 2940.91 to its Dec. 24, 2018 intraday low of 2351.1. The S&P fell 21.5% from its May 2, 2011 high of 1,370.58 to its Oct. 4, 2011 low of 1074.77.
And frankly, is a 19% decline really that different from a 20% decline?
“The S&P 500 has had 20% corrections 3 times over the past 10 years,” writes J.C. Parets. “The crazies will tell you that because one of those was down just 19% or something stupid like that, it doesn’t count [LAUGHS]. I’m serious, they actually do that. And worse, people listen.”
Parets will further remind you that “20% is a completely arbitrary number.“
Also, this whole discussion only ever seems to come up in the context of the bull market being “old.” But as we know, bull markets don’t die of old age. Because whether you call it a one-year-old bull market or a ten-year-old bull market, the underlying fundamentals are still the same. The earnings are the same. The economic conditions are the same. It’s all the same.
In a recent note to clients, Leuthold Group’s Jim Paulsen went through the mental exercise of assuming the late-2018 correction was actually a bear market. In his note, Paulsen shared the following chart to show how this year’s post-bear rally stacks up against history.
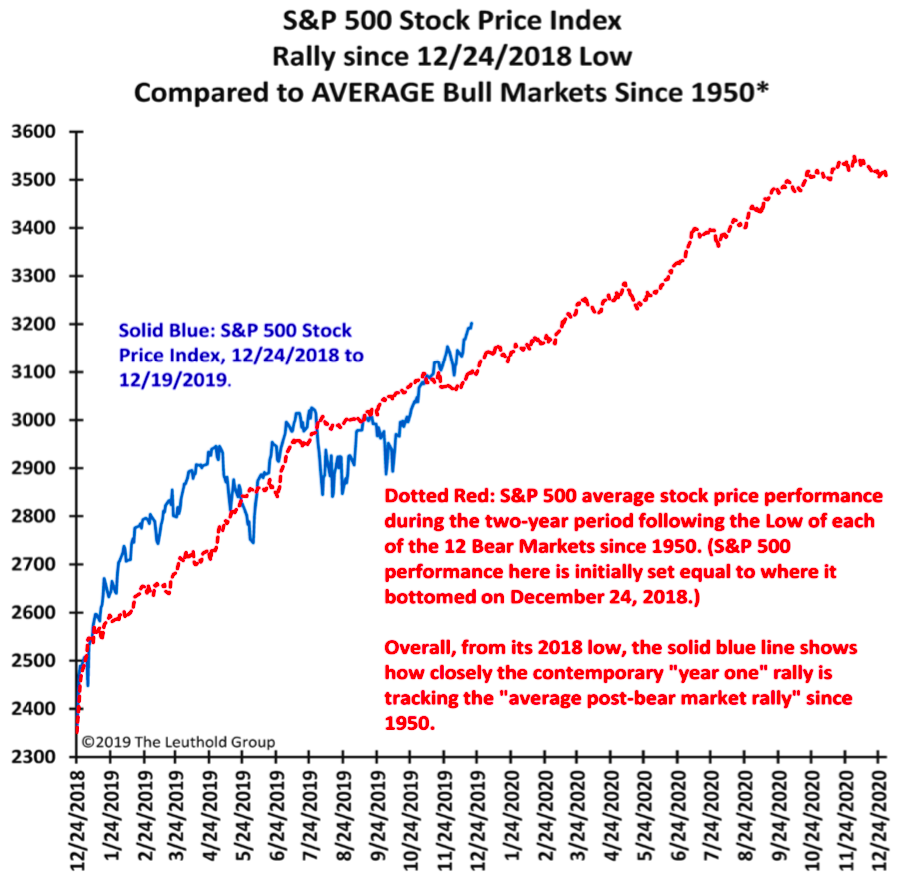
“So far, from the ‘correction’ last year, this year’s U.S. stock market rally is nearly on par with the average post-war, first-year bull run,” Paulsen wrote.
“As shown, it has run a bit hotter at some points this year, and at times a bit colder. But, overall, the 2019 stock market appears to be ending its first year with a very similar performance for the average ‘first-year’ following a bear market low,” he added.
And so once again, the historical evidence (see here, here, and here) says it’s not crazy to think stock can go a lot higher from here.
By Sam Ro, managing editor. Follow him at @SamRo

Top News
New Boeing CEO David Calhoun's political ties raise concerns, experts say [Yahoo Finance]
The ‘fire and ice’ decade that changed everything on Wall Street [Bloomberg]
Stock market bubble is forming and a 50% plunge is inevitable: strategist [Yahoo Finance]
Amazon leads S&P 500 after reporting ‘record’ holiday sales [Bloomberg]
YAHOO FINANCE HIGHLIGHTS
Brexit, US elections and trade war leave investors glued to politics in 2020
Cannabis investors could get a tax break in Opportunity Zones
The hottest jobs of 2019 and what's next for 2020
Follow Yahoo Finance on Twitter, Facebook, Instagram, Flipboard, SmartNews, LinkedIn, YouTube, and reddit.

