Is Burkhalter Holding AG's (VTX:BRKN) High P/E Ratio A Problem For Investors?

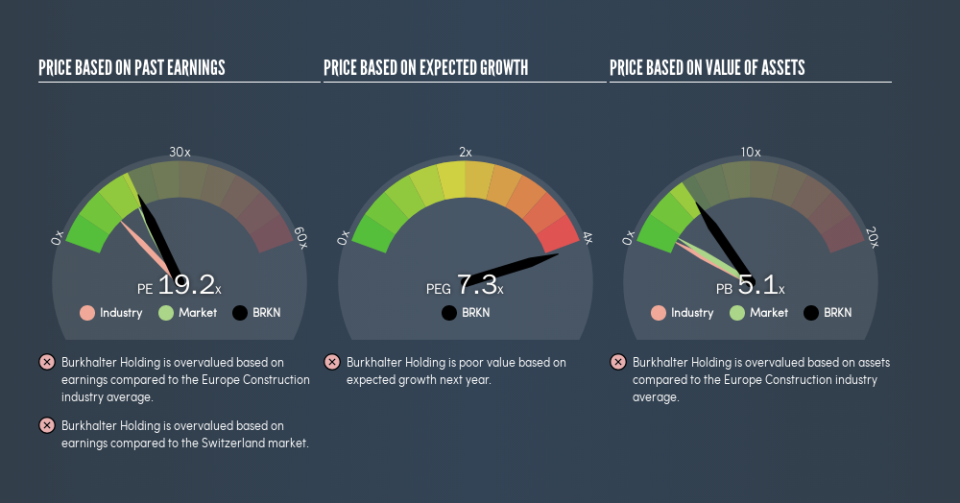
Today, we'll introduce the concept of the P/E ratio for those who are learning about investing. We'll show how you can use Burkhalter Holding AG's (VTX:BRKN) P/E ratio to inform your assessment of the investment opportunity. Based on the last twelve months, Burkhalter Holding's P/E ratio is 19.16. That corresponds to an earnings yield of approximately 5.2%.
View our latest analysis for Burkhalter Holding
How Do You Calculate A P/E Ratio?
The formula for P/E is:
Price to Earnings Ratio = Share Price ÷ Earnings per Share (EPS)
Or for Burkhalter Holding:
P/E of 19.16 = CHF75.1 ÷ CHF3.92 (Based on the trailing twelve months to December 2018.)
Is A High Price-to-Earnings Ratio Good?
A higher P/E ratio means that buyers have to pay a higher price for each CHF1 the company has earned over the last year. That is not a good or a bad thing per se, but a high P/E does imply buyers are optimistic about the future.
Does Burkhalter Holding Have A Relatively High Or Low P/E For Its Industry?
One good way to get a quick read on what market participants expect of a company is to look at its P/E ratio. As you can see below, Burkhalter Holding has a higher P/E than the average company (11.2) in the construction industry.
Its relatively high P/E ratio indicates that Burkhalter Holding shareholders think it will perform better than other companies in its industry classification. The market is optimistic about the future, but that doesn't guarantee future growth. So investors should delve deeper. I like to check if company insiders have been buying or selling.
How Growth Rates Impact P/E Ratios
When earnings fall, the 'E' decreases, over time. That means even if the current P/E is low, it will increase over time if the share price stays flat. Then, a higher P/E might scare off shareholders, pushing the share price down.
Burkhalter Holding saw earnings per share decrease by 22% last year. And EPS is down 2.6% a year, over the last 5 years. This could justify a pessimistic P/E.
Don't Forget: The P/E Does Not Account For Debt or Bank Deposits
It's important to note that the P/E ratio considers the market capitalization, not the enterprise value. So it won't reflect the advantage of cash, or disadvantage of debt. Theoretically, a business can improve its earnings (and produce a lower P/E in the future) by investing in growth. That means taking on debt (or spending its cash).
Such spending might be good or bad, overall, but the key point here is that you need to look at debt to understand the P/E ratio in context.
So What Does Burkhalter Holding's Balance Sheet Tell Us?
Since Burkhalter Holding holds net cash of CHF36m, it can spend on growth, justifying a higher P/E ratio than otherwise.
The Verdict On Burkhalter Holding's P/E Ratio
Burkhalter Holding's P/E is 19.2 which is above average (17.8) in its market. The recent drop in earnings per share might keep value investors away, but the relatively strong balance sheet will allow the company time to invest in growth. Clearly, the high P/E indicates shareholders think it will!
Investors have an opportunity when market expectations about a stock are wrong. As value investor Benjamin Graham famously said, 'In the short run, the market is a voting machine but in the long run, it is a weighing machine.' So this free report on the analyst consensus forecasts could help you make a master move on this stock.
Of course you might be able to find a better stock than Burkhalter Holding. So you may wish to see this free collection of other companies that have grown earnings strongly.
We aim to bring you long-term focused research analysis driven by fundamental data. Note that our analysis may not factor in the latest price-sensitive company announcements or qualitative material.
If you spot an error that warrants correction, please contact the editor at editorial-team@simplywallst.com. This article by Simply Wall St is general in nature. It does not constitute a recommendation to buy or sell any stock, and does not take account of your objectives, or your financial situation. Simply Wall St has no position in the stocks mentioned. Thank you for reading.

