Should You Buy Inter Pipeline Ltd. (TSE:IPL) For Its Dividend?

Want to participate in a short research study? Help shape the future of investing tools and you could win a $250 gift card!
Is Inter Pipeline Ltd. (TSE:IPL) a good dividend stock? How would you know? Dividend paying companies with growing earnings can be highly rewarding in the long term. On the other hand, investors have been known to buy a stock because of its yield, and then lose money if the company's dividend doesn't live up to expectations.
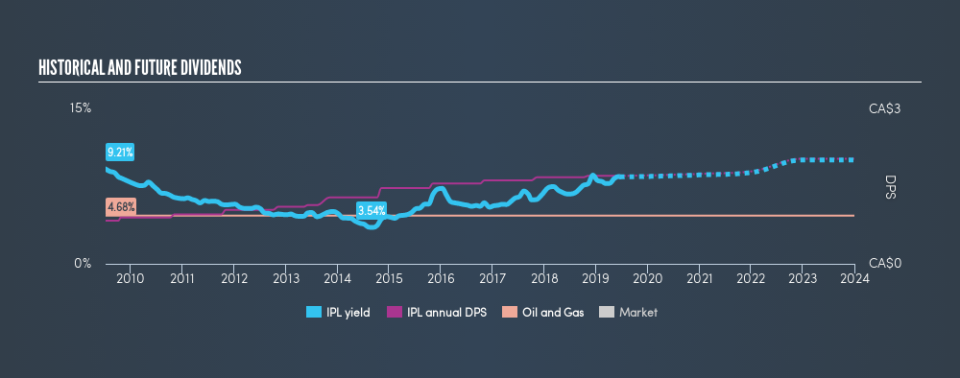
In this case, Inter Pipeline likely looks attractive to investors, given its 8.4% dividend yield and a payment history of over ten years. We'd guess that plenty of investors have purchased it for the income. There are a few simple ways to reduce the risks of buying Inter Pipeline for its dividend, and we'll go through these below.
Click the interactive chart for our full dividend analysis
Payout ratios
Dividends are typically paid from company earnings. If a company pays more in dividends than it earned, then the dividend might become unsustainable - hardly an ideal situation. Comparing dividend payments to a company's net profit after tax is a simple way of reality-checking whether a dividend is sustainable. In the last year, Inter Pipeline paid out 122% of its profit as dividends. Unless there are extenuating circumstances, from the perspective of an investor who hopes to own the company for many years, a payout ratio of above 100% is definitely a concern.
We also measure dividends paid against a company's levered free cash flow, to see if enough cash was generated to cover the dividend. Unfortunately, while Inter Pipeline pays a dividend, it also reported negative free cash flow last year. While there may be a good reason for this, it's not ideal from a dividend perspective. It's good to see that while Inter Pipeline's dividends were not covered by profits, at least they are affordable from a cash perspective. Still, if the company repeatedly paid a dividend greater than its profits, we'd be concerned. Extraordinarily few companies are capable of persistently paying a dividend that is greater than their profits.
Is Inter Pipeline's Balance Sheet Risky?
As Inter Pipeline's dividend was not well covered by earnings, we need to check its balance sheet for signs of financial distress. A rough way to check this is with these two simple ratios: a) net debt divided by EBITDA (earnings before interest, tax, depreciation and amortisation), and b) net interest cover. Net debt to EBITDA measures a company's total debt load relative to its earnings (lower = less debt), while net interest cover measures the company's ability to pay the interest on its debt (higher = greater ability to pay interest costs). Inter Pipeline has net debt of more than 3x its EBITDA, which is getting towards the limit of most investors' comfort zones. Judicious use of debt can enhance shareholder returns, but also adds to the risk if something goes awry.
Net interest cover can be calculated by dividing earnings before interest and tax (EBIT) by the company's net interest expense. Net interest cover of 5.81 times its interest expense appears reasonable for Inter Pipeline, although we're conscious that even high interest cover doesn't make a company bulletproof.
Consider getting our latest analysis on Inter Pipeline's financial position here.
Dividend Volatility
From the perspective of an income investor who wants to earn dividends for many years, there is not much point buying a stock if its dividend is regularly cut or is not reliable. For the purpose of this article, we only scrutinise the last decade of Inter Pipeline's dividend payments. During this period the dividend has been stable, which could imply the business could have relatively consistent earnings power. During the past ten-year period, the first annual payment was CA$0.84 in 2009, compared to CA$1.71 last year. This works out to be a compound annual growth rate (CAGR) of approximately 7.4% a year over that time.
Companies like this, growing their dividend at a decent rate, can be very valuable over the long term, if the rate of growth can be maintained.
Dividend Growth Potential
Dividend payments have been consistent over the past few years, but we should always check if earnings per share (EPS) are growing, as this will help maintain the purchasing power of the dividend. Strong earnings per share (EPS) growth might encourage our interest in the company despite fluctuating dividends, which is why it's great to see Inter Pipeline has grown its earnings per share at 13% per annum over the past five years. With a payout ratio of 122%, Inter Pipeline is paying out substantially more than it earned in dividends. This is a risky practice.
We'd also point out that Inter Pipeline issued a meaningful number of new shares in the past year. Trying to grow the dividend when issuing new shares reminds us of the ancient Greek tale of Sisyphus - perpetually pushing a boulder uphill. Companies that consistently issue new shares are often suboptimal from a dividend perspective.
Conclusion
Dividend investors should always want to know if a) a company's dividends are affordable, b) if there is a track record of consistent payments, and c) if the dividend is capable of growing. Inter Pipeline paid out almost all of its cash flow and profit as dividends, leaving little to reinvest in the business. Next, growing earnings per share and steady dividend payments is a great combination. Ultimately, Inter Pipeline comes up short on our dividend analysis. It's not that we think it is a bad company - just that there are likely more appealing dividend prospects out there on this analysis.
Earnings growth generally bodes well for the future value of company dividend payments. See if the 10 Inter Pipeline analysts we track are forecasting continued growth with our free report on analyst estimates for the company.
Looking for more high-yielding dividend ideas? Try our curated list of dividend stocks with a yield above 3%.
We aim to bring you long-term focused research analysis driven by fundamental data. Note that our analysis may not factor in the latest price-sensitive company announcements or qualitative material.
If you spot an error that warrants correction, please contact the editor at editorial-team@simplywallst.com. This article by Simply Wall St is general in nature. It does not constitute a recommendation to buy or sell any stock, and does not take account of your objectives, or your financial situation. Simply Wall St has no position in the stocks mentioned. Thank you for reading.

