Before You Buy NewLink Genetics Corporation (NASDAQ:NLNK), Consider Its Volatility

If you’re interested in NewLink Genetics Corporation (NASDAQ:NLNK), then you might want to consider its beta (a measure of share price volatility) in order to understand how the stock could impact your portfolio. Volatility is considered to be a measure of risk in modern finance theory. Investors may think of volatility as falling into two main categories. The first type is company specific volatility. Investors use diversification across uncorrelated stocks to reduce this kind of price volatility across the portfolio. The second sort is caused by the natural volatility of markets, overall. For example, certain macroeconomic events will impact (virtually) all stocks on the market.
Some stocks are more sensitive to general market forces than others. Some investors use beta as a measure of how much a certain stock is impacted by market risk (volatility). While we should keep in mind that Warren Buffett has cautioned that ‘Volatility is far from synonymous with risk’, beta is still a useful factor to consider. To make good use of it you must first know that the beta of the overall market is one. Any stock with a beta of greater than one is considered more volatile than the market, while those with a beta below one are either less volatile or poorly correlated with the market.
View our latest analysis for NewLink Genetics
Want to help shape the future of investing tools and platforms? Take the survey and be part of one of the most advanced studies of stock market investors to date.
What we can learn from NLNK’s beta value
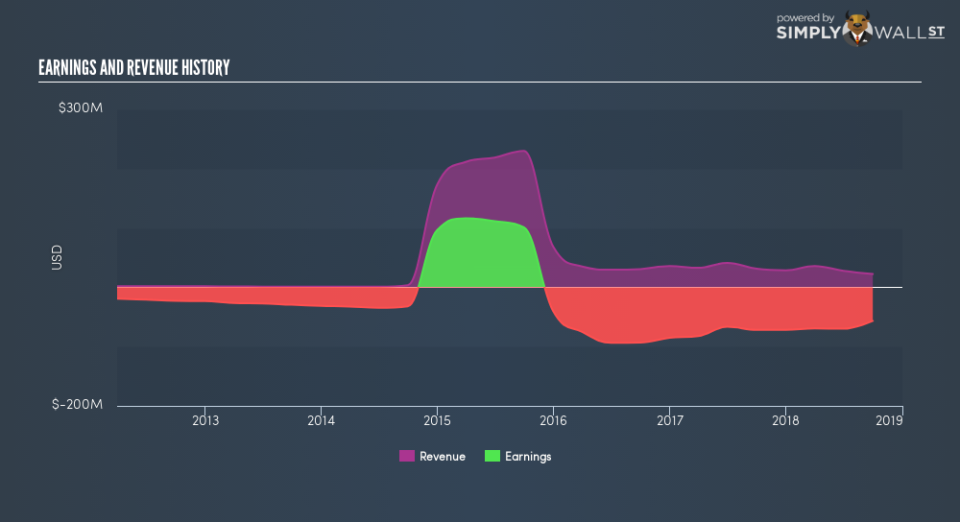
Zooming in on NewLink Genetics, we see it has a five year beta of 1.49. This is above 1, so historically its share price has been influenced by the broader volatility of the stock market the market. If the past is any guide, we would expect that NewLink Genetics shares will rise quicker than the markets in times of optimism, but fall faster in times of pessimism. Many would argue that beta is useful in position sizing, but fundamental metrics such as revenue and earnings are more important overall. You can see NewLink Genetics’s revenue and earnings in the image below.
Does NLNK’s size influence the expected beta?
NewLink Genetics is a rather small company. It has a market capitalisation of US$57m, which means it is probably under the radar of most investors. It has a relatively high beta, suggesting it is fairly actively traded for a company of its size. Because it takes less capital to move the share price of a small company like this, when a stock this size is actively traded it is quite often more sensitive to market volatility than similar large companies.
What this means for you:
Since NewLink Genetics has a reasonably high beta, it’s worth considering why it is so heavily influenced by broader market sentiment. For example, it might be a high growth stock or have a lot of operating leverage in its business model. This article aims to educate investors about beta values, but it’s well worth looking at important company-specific fundamentals such as NewLink Genetics’s financial health and performance track record. I highly recommend you dive deeper by considering the following:
Future Outlook: What are well-informed industry analysts predicting for NLNK’s future growth? Take a look at our free research report of analyst consensus for NLNK’s outlook.
Past Track Record: Has NLNK been consistently performing well irrespective of the ups and downs in the market? Go into more detail in the past performance analysis and take a look at the free visual representations of NLNK’s historicals for more clarity.
Other Interesting Stocks: It’s worth checking to see how NLNK measures up against other companies on valuation. You could start with this free list of prospective options.
To help readers see past the short term volatility of the financial market, we aim to bring you a long-term focused research analysis purely driven by fundamental data. Note that our analysis does not factor in the latest price-sensitive company announcements.
The author is an independent contributor and at the time of publication had no position in the stocks mentioned. For errors that warrant correction please contact the editor at editorial-team@simplywallst.com.
