What Can We Make Of Campine NV’s (EBR:CAMB) High Return On Capital?

Today we'll evaluate Campine NV (EBR:CAMB) to determine whether it could have potential as an investment idea. Specifically, we're going to calculate its Return On Capital Employed (ROCE), in the hopes of getting some insight into the business.
First, we'll go over how we calculate ROCE. Second, we'll look at its ROCE compared to similar companies. Finally, we'll look at how its current liabilities affect its ROCE.
What is Return On Capital Employed (ROCE)?
ROCE measures the amount of pre-tax profits a company can generate from the capital employed in its business. In general, businesses with a higher ROCE are usually better quality. In brief, it is a useful tool, but it is not without drawbacks. Author Edwin Whiting says to be careful when comparing the ROCE of different businesses, since 'No two businesses are exactly alike.'
How Do You Calculate Return On Capital Employed?
The formula for calculating the return on capital employed is:
Return on Capital Employed = Earnings Before Interest and Tax (EBIT) ÷ (Total Assets - Current Liabilities)
Or for Campine:
0.25 = €8.0m ÷ (€62m - €30m) (Based on the trailing twelve months to December 2018.)
So, Campine has an ROCE of 25%.
View our latest analysis for Campine
Does Campine Have A Good ROCE?
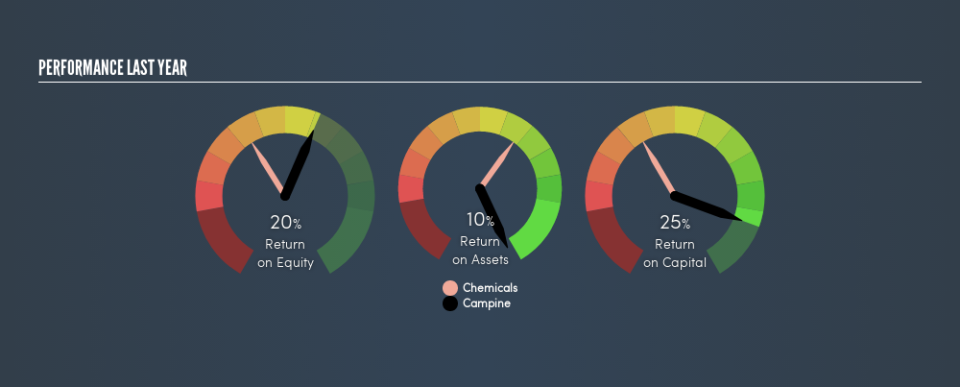
ROCE can be useful when making comparisons, such as between similar companies. Campine's ROCE appears to be substantially greater than the 7.4% average in the Chemicals industry. We consider this a positive sign, because it suggests it uses capital more efficiently than similar companies. Setting aside the comparison to its industry for a moment, Campine's ROCE in absolute terms currently looks quite high.
Our data shows that Campine currently has an ROCE of 25%, compared to its ROCE of 8.3% 3 years ago. This makes us think about whether the company has been reinvesting shrewdly. You can see in the image below how Campine's ROCE compares to its industry. Click to see more on past growth.
Remember that this metric is backwards looking - it shows what has happened in the past, and does not accurately predict the future. Companies in cyclical industries can be difficult to understand using ROCE, as returns typically look high during boom times, and low during busts. This is because ROCE only looks at one year, instead of considering returns across a whole cycle. You can check if Campine has cyclical profits by looking at this free graph of past earnings, revenue and cash flow.
Campine's Current Liabilities And Their Impact On Its ROCE
Short term (or current) liabilities, are things like supplier invoices, overdrafts, or tax bills that need to be paid within 12 months. Due to the way the ROCE equation works, having large bills due in the near term can make it look as though a company has less capital employed, and thus a higher ROCE than usual. To counteract this, we check if a company has high current liabilities, relative to its total assets.
Campine has total liabilities of €30m and total assets of €62m. Therefore its current liabilities are equivalent to approximately 48% of its total assets. Campine's ROCE is boosted somewhat by its middling amount of current liabilities.
What We Can Learn From Campine's ROCE
Still, it has a high ROCE, and may be an interesting prospect for further research. Campine looks strong on this analysis, but there are plenty of other companies that could be a good opportunity . Here is a free list of companies growing earnings rapidly.
I will like Campine better if I see some big insider buys. While we wait, check out this free list of growing companies with considerable, recent, insider buying.
We aim to bring you long-term focused research analysis driven by fundamental data. Note that our analysis may not factor in the latest price-sensitive company announcements or qualitative material.
If you spot an error that warrants correction, please contact the editor at editorial-team@simplywallst.com. This article by Simply Wall St is general in nature. It does not constitute a recommendation to buy or sell any stock, and does not take account of your objectives, or your financial situation. Simply Wall St has no position in the stocks mentioned. Thank you for reading.

