Carrianna Group Holdings Company Limited’s (HKG:126) Investment Returns Are Lagging Its Industry

Today we'll evaluate Carrianna Group Holdings Company Limited (HKG:126) to determine whether it could have potential as an investment idea. Specifically, we'll consider its Return On Capital Employed (ROCE), since that will give us an insight into how efficiently the business can generate profits from the capital it requires.
First up, we'll look at what ROCE is and how we calculate it. Then we'll compare its ROCE to similar companies. Finally, we'll look at how its current liabilities affect its ROCE.
What is Return On Capital Employed (ROCE)?
ROCE is a measure of a company's yearly pre-tax profit (its return), relative to the capital employed in the business. All else being equal, a better business will have a higher ROCE. Ultimately, it is a useful but imperfect metric. Renowned investment researcher Michael Mauboussin has suggested that a high ROCE can indicate that 'one dollar invested in the company generates value of more than one dollar'.
So, How Do We Calculate ROCE?
Analysts use this formula to calculate return on capital employed:
Return on Capital Employed = Earnings Before Interest and Tax (EBIT) ÷ (Total Assets - Current Liabilities)
Or for Carrianna Group Holdings:
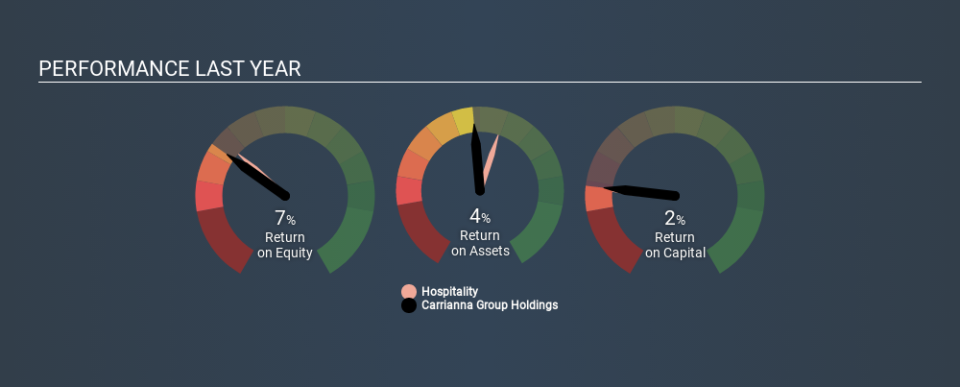
0.02 = HK$93m ÷ (HK$6.8b - HK$2.2b) (Based on the trailing twelve months to September 2019.)
Therefore, Carrianna Group Holdings has an ROCE of 2.0%.
View our latest analysis for Carrianna Group Holdings
Does Carrianna Group Holdings Have A Good ROCE?
ROCE can be useful when making comparisons, such as between similar companies. In this analysis, Carrianna Group Holdings's ROCE appears meaningfully below the 5.4% average reported by the Hospitality industry. This performance could be negative if sustained, as it suggests the business may underperform its industry. Putting aside Carrianna Group Holdings's performance relative to its industry, its ROCE in absolute terms is poor - considering the risk of owning stocks compared to government bonds. There are potentially more appealing investments elsewhere.
You can click on the image below to see (in greater detail) how Carrianna Group Holdings's past growth compares to other companies.
When considering ROCE, bear in mind that it reflects the past and does not necessarily predict the future. Companies in cyclical industries can be difficult to understand using ROCE, as returns typically look high during boom times, and low during busts. ROCE is only a point-in-time measure. How cyclical is Carrianna Group Holdings? You can see for yourself by looking at this free graph of past earnings, revenue and cash flow.
Carrianna Group Holdings's Current Liabilities And Their Impact On Its ROCE
Current liabilities are short term bills and invoices that need to be paid in 12 months or less. The ROCE equation subtracts current liabilities from capital employed, so a company with a lot of current liabilities appears to have less capital employed, and a higher ROCE than otherwise. To counteract this, we check if a company has high current liabilities, relative to its total assets.
Carrianna Group Holdings has total assets of HK$6.8b and current liabilities of HK$2.2b. As a result, its current liabilities are equal to approximately 32% of its total assets. With a medium level of current liabilities boosting the ROCE a little, Carrianna Group Holdings's low ROCE is unappealing.
Our Take On Carrianna Group Holdings's ROCE
This company may not be the most attractive investment prospect. Of course, you might also be able to find a better stock than Carrianna Group Holdings. So you may wish to see this free collection of other companies that have grown earnings strongly.
For those who like to find winning investments this free list of growing companies with recent insider purchasing, could be just the ticket.
If you spot an error that warrants correction, please contact the editor at editorial-team@simplywallst.com. This article by Simply Wall St is general in nature. It does not constitute a recommendation to buy or sell any stock, and does not take account of your objectives, or your financial situation. Simply Wall St has no position in the stocks mentioned.
We aim to bring you long-term focused research analysis driven by fundamental data. Note that our analysis may not factor in the latest price-sensitive company announcements or qualitative material. Thank you for reading.
