Cegedim SA’s (EPA:CGM) Investment Returns Are Lagging Its Industry

Want to participate in a short research study? Help shape the future of investing tools and you could win a $250 gift card!
Today we'll look at Cegedim SA (EPA:CGM) and reflect on its potential as an investment. Specifically, we'll consider its Return On Capital Employed (ROCE), since that will give us an insight into how efficiently the business can generate profits from the capital it requires.
First of all, we'll work out how to calculate ROCE. Second, we'll look at its ROCE compared to similar companies. Last but not least, we'll look at what impact its current liabilities have on its ROCE.
Understanding Return On Capital Employed (ROCE)
ROCE measures the amount of pre-tax profits a company can generate from the capital employed in its business. Generally speaking a higher ROCE is better. Overall, it is a valuable metric that has its flaws. Author Edwin Whiting says to be careful when comparing the ROCE of different businesses, since 'No two businesses are exactly alike.'
So, How Do We Calculate ROCE?
The formula for calculating the return on capital employed is:
Return on Capital Employed = Earnings Before Interest and Tax (EBIT) ÷ (Total Assets - Current Liabilities)
Or for Cegedim:
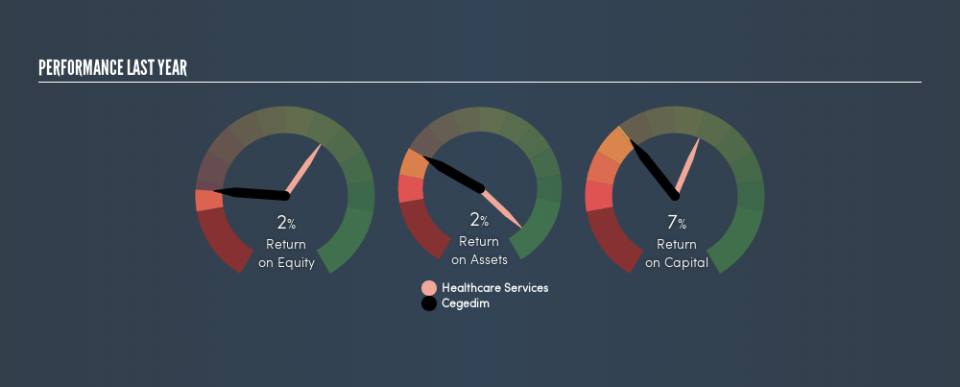
0.074 = €31m ÷ (€648m - €229m) (Based on the trailing twelve months to December 2018.)
Therefore, Cegedim has an ROCE of 7.4%.
Check out our latest analysis for Cegedim
Does Cegedim Have A Good ROCE?
ROCE is commonly used for comparing the performance of similar businesses. In this analysis, Cegedim's ROCE appears meaningfully below the 12% average reported by the Healthcare Services industry. This could be seen as a negative, as it suggests some competitors may be employing their capital more efficiently. Aside from the industry comparison, Cegedim's ROCE is mediocre in absolute terms, considering the risk of investing in stocks versus the safety of a bank account. Investors may wish to consider higher-performing investments.
Cegedim's current ROCE of 7.4% is lower than its ROCE in the past, which was 15%, 3 years ago. This makes us wonder if the business is facing new challenges. You can click on the image below to see (in greater detail) how Cegedim's past growth compares to other companies.
It is important to remember that ROCE shows past performance, and is not necessarily predictive. ROCE can be misleading for companies in cyclical industries, with returns looking impressive during the boom times, but very weak during the busts. ROCE is only a point-in-time measure. Future performance is what matters, and you can see analyst predictions in our free report on analyst forecasts for the company.
Do Cegedim's Current Liabilities Skew Its ROCE?
Short term (or current) liabilities, are things like supplier invoices, overdrafts, or tax bills that need to be paid within 12 months. Due to the way the ROCE equation works, having large bills due in the near term can make it look as though a company has less capital employed, and thus a higher ROCE than usual. To counteract this, we check if a company has high current liabilities, relative to its total assets.
Cegedim has total assets of €648m and current liabilities of €229m. As a result, its current liabilities are equal to approximately 35% of its total assets. Cegedim's middling level of current liabilities have the effect of boosting its ROCE a bit.
The Bottom Line On Cegedim's ROCE
Despite this, its ROCE is still mediocre, and you may find more appealing investments elsewhere. Of course, you might find a fantastic investment by looking at a few good candidates. So take a peek at this free list of companies with modest (or no) debt, trading on a P/E below 20.
For those who like to find winning investments this free list of growing companies with recent insider purchasing, could be just the ticket.
We aim to bring you long-term focused research analysis driven by fundamental data. Note that our analysis may not factor in the latest price-sensitive company announcements or qualitative material.
If you spot an error that warrants correction, please contact the editor at editorial-team@simplywallst.com. This article by Simply Wall St is general in nature. It does not constitute a recommendation to buy or sell any stock, and does not take account of your objectives, or your financial situation. Simply Wall St has no position in the stocks mentioned. Thank you for reading.
